Choosing between Ollama vLLM llama.cpp means choosing a local inference engine: the software that loads a model into memory and answers requests. All three are open source and all three expose an HTTP API, yet they do not serve the same need. This article compares their typical use, what each offers for monitoring and how to decide.
The angle is that of an SRE or platform team. The question is not only “which is fastest?” but “which can we run, monitor and secure?”. The statements below come from each project’s official documentation, read at the time of writing. No benchmark is given: results depend too much on hardware and model.
Ollama vLLM llama.cpp: three philosophies
Ollama aims for simplicity. Its repository presents a REST API for running and managing models, and an ollama run command to chat with a model. It is published under the MIT licence. Its installation is covered in our guide Ollama local LLM.
vLLM describes itself as a library for LLM inference and serving, “easy, fast, and cheap”. Its documentation highlights PagedAttention for attention memory, continuous batching, chunked prefill and prefix caching. It provides an OpenAI-compatible API server. See also vLLM in production.
llama.cpp is a plain C/C++ implementation with no dependencies, built on the ggml library. Its README lists many backends: Metal on Apple Silicon, CUDA, HIP, Vulkan, SYCL, plus hybrid CPU and GPU inference for models larger than VRAM. It lists quantisation from 1.5 to 8 bits. Its server, llama-server, is covered in our article llama.cpp local inference.
Comparison: what each engine brings
| Criterion | Ollama | vLLM | llama.cpp |
|---|---|---|---|
| Getting started | One command to run a model | vllm serve command |
llama-server binary and a model file |
| Hardware named in the documentation | Not detailed in the pages read | NVIDIA and AMD GPUs, x86, ARM and PowerPC CPUs, plugins | Very wide: Metal, CUDA, HIP, Vulkan, SYCL, CPU |
| Concurrency | Configurable per-model parallelism and queue | Continuous batching | Slots (--parallel) and continuous batching enabled by default |
| Prometheus metrics | Not verified in the FAQ read | /metrics endpoint |
/metrics endpoint with the --metrics option |
| Authentication | Not verified; reverse proxy advised | Not verified in the pages read | --api-key option |
“Not verified” cells mean the information is missing from the pages consulted, not that the feature is missing. Re-read the documentation for the version you deploy.
How to choose a local engine by use case
Developer workstation or small internal service
Ollama is the most direct choice. Models are downloaded and run without compiling anything. Its FAQ documents what a shared setup needs: OLLAMA_NUM_PARALLEL sets how many requests each model processes in parallel (1 by default), OLLAMA_MAX_QUEUE the queue length before rejection (512 by default) and OLLAMA_MAX_LOADED_MODELS the number of models loaded at once.
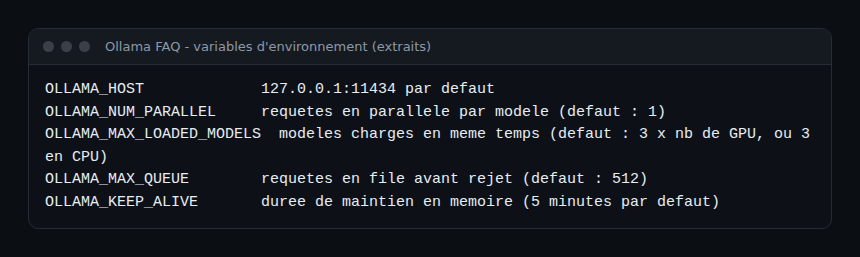
The FAQ states that the server listens on 127.0.0.1, port 11434 by default, and that OLLAMA_HOST changes the address. It also notes that parallel requests enlarge the effective context: a 2K context with 4 parallel requests becomes 8K, hence more memory.
High-traffic service on GPUs
When many clients call the same model, vLLM is built for it: continuous batching groups in-flight requests. Its operational advantage is the richness of its metrics, detailed below. The cost is a heavier installation and more demanding hardware.
Varied hardware, CPU, Mac or edge
llama.cpp covers the most platforms and runs a quantised model on a modest machine. It also suits teams that want fine control over options, or want to embed the engine in other software.
Monitoring the engine you chose
A local engine is a service like any other, with its own SLIs. The most useful are availability, time to first token, end-to-end latency, queue length and error rate. A p95 latency SLO prevents GPU saturation from being discovered by users.
vLLM: rich metrics
vLLM’s design documentation describes the metrics exposed on /metrics in Prometheus format. They include:
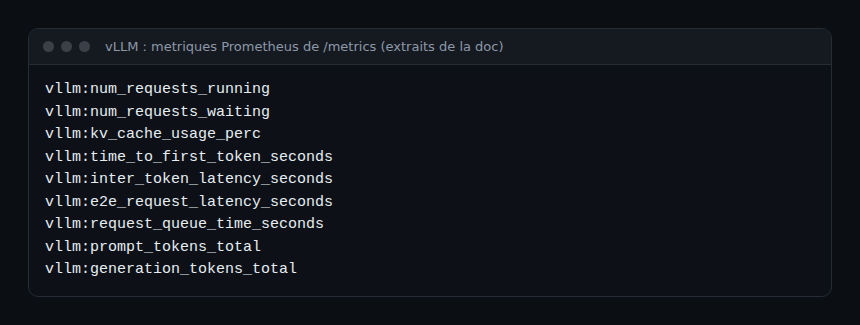
These names are enough to build a dashboard: saturation (waiting requests, KV cache), latency (histograms) and throughput (token counters). The page also flags some metrics as deprecated or unimplemented: check the list for your version before creating alerts.
llama.cpp: health, slots and optional metrics
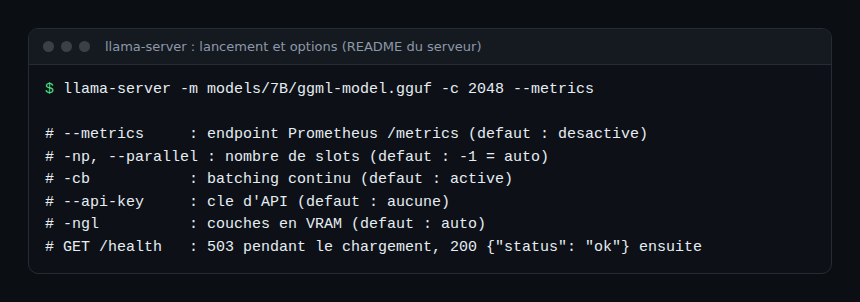
The server README describes /health, which is public and skips the API key check: it returns 503 while the model loads, then 200 with {"status": "ok"}. The Prometheus-compatible /metrics endpoint exists only if the server starts with --metrics (disabled by default). A /slots endpoint reports slot processing state; it is enabled by default and disabled with --no-slots.
Ollama: probes and client-side traces
The pages consulted do not describe a Prometheus endpoint for Ollama: that point remains unverified, so check the release notes. In practice, teams rely on the API (availability probe, durations returned in responses), service logs and application-side traces. An OpenTelemetry Collector can then route these signals to Dynatrace or another backend, as described in end-to-end OpenTelemetry. For per-call tracking, client-side instrumentation is often the most uniform option across the three engines: it produces spans of the same shape whichever server sits behind an OpenAI-compatible API.
Best practices
- Choose from expected traffic and available hardware, not from a general ranking.
- Keep the default local listening address and put a reverse proxy with access control in front of the service.
- Enable
--metricson llama-server from the start; a missing metric cannot be recovered after an incident. - Set a latency SLO and alert on queue length before saturation.
- Measure with your own models and requests before deciding.
- Avoid keeping full prompts in traces if they contain personal data.
Frequently asked questions
What is the difference between Ollama and llama.cpp?
llama.cpp is the inference engine and its server; Ollama adds model management and a simple API on top. The first gives more control, the second more comfort.
Does vLLM work without a GPU?
Its documentation names x86, ARM and PowerPC CPUs besides NVIDIA and AMD GPUs. Performance and support for a given model must be checked version by version.
Which engine is the easiest to monitor?
According to the pages read, vLLM and llama.cpp expose a Prometheus endpoint; for Ollama, monitoring relies mainly on the API, logs and client-side traces.
Conclusion
Ollama suits simple, shared use at small scale, vLLM suits GPU throughput, and llama.cpp suits hardware diversity and fine control. In every case, latency, queue and availability SLIs fed by Prometheus or OpenTelemetry make the choice reversible. To place these engines in a complete architecture, see the comparison of self-hosted open source AI stacks. References: vLLM documentation, llama.cpp repository, Ollama repository.
span.observer is an independent blog, not affiliated with Dynatrace LLC or with the Ollama, vLLM and llama.cpp projects. Trademarks belong to their owners. These tools change quickly: check options in their official documentation.