



Putting vLLM into production means moving from an LLM that “works on my machine” to an inference service able to absorb hundreds of concurrent requests on datacentre GPUs. Born in a lab at the University of California, Berkeley and now hosted by the PyTorch Foundation, vLLM is one of the most followed open source projects on GitHub for serving language models. This guide covers the vLLM production metrics that matter, alongside the OpenAI-compatible server and GPU monitoring.
Its strength rests on two ideas: PagedAttention, which manages the key-value cache (KV cache) memory in pages, the way an operating system manages virtual memory, and continuous batching, which inserts new requests into the running batch instead of waiting for it to finish. The result: much better utilisation of GPUs, which are expensive.
For an SRE, vLLM has another quality: it natively exposes a rich Prometheus endpoint and can emit OpenTelemetry traces. Let us see how to install it, run it as an OpenAI-compatible server, then monitor it all the way into Dynatrace.
Why choose vLLM in production?
vLLM meets a specific need: serving open models (Llama, Mistral, Qwen, Gemma…) from Hugging Face with high throughput. It offers:
- an HTTP server compatible with the OpenAI API (
/v1/chat/completions,/v1/completions,/v1/models…), so it can be used with existing SDKs; - tensor and pipeline parallelism to spread a large model across several GPUs;
- support for many quantised formats and several hardware families (NVIDIA first and foremost, but also AMD and other accelerators depending on the version).
Its limits: it assumes a serious GPU, its startup time is long (loading weights, compilation, memory pre-allocation) and its many settings require some experience. For a developer workstation, Ollama locally or llama.cpp are lighter.
In practice: deploying an OpenAI-compatible vLLM server
Step 1 — Install vLLM
On a Linux machine with an NVIDIA GPU and recent CUDA drivers, installation is done with pip, preferably in a virtual environment:
python3 -m venv .venv && source .venv/bin/activate
pip install vllm
The supported combinations of Python, CUDA and PyTorch versions change often: check them in the official vLLM installation guide.
Step 2 — Start the server
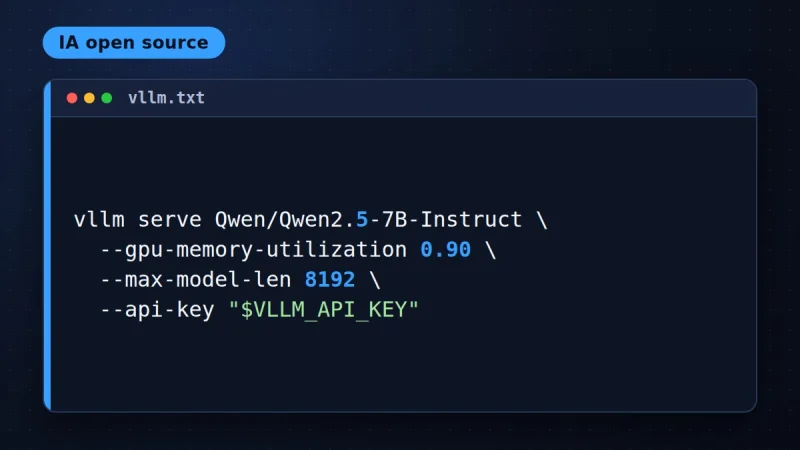
The vllm serve command starts the OpenAI-compatible server, on port 8000 by default. For a gated model on Hugging Face, first export a token in HF_TOKEN:
vllm serve Qwen/Qwen2.5-7B-Instruct \
  --gpu-memory-utilization 0.90 \
  --max-model-len 8192 \
  --api-key "$VLLM_API_KEY"
--gpu-memory-utilization sets the fraction of GPU memory vLLM allows itself, --max-model-len limits the context length (and therefore the KV cache size), and --tensor-parallel-size spreads the model across several GPUs. The full list of options is available with vllm serve --help.
Step 3 — Or use the Docker image
docker run --gpus all --ipc=host -p 8000:8000 \
  -v ~/.cache/huggingface:/root/.cache/huggingface \
  -e HF_TOKEN="$HF_TOKEN" \
  vllm/vllm-openai:latest \
  --model Qwen/Qwen2.5-7B-Instruct
In production, replace latest with a specific version. On Kubernetes, the documentation offers deployment examples and community charts; allow a generous startup probe, as loading a large model takes several minutes.
Step 4 — Test the API
curl -s http://localhost:8000/v1/chat/completions \
  -H "Authorization: Bearer $VLLM_API_KEY" \
  -H "Content-Type: application/json" \
  -d '{"model": "Qwen/Qwen2.5-7B-Instruct",
       "messages": [{"role": "user", "content": "Hello"}]}'
curl -s http://localhost:8000/health
Which vLLM production metrics should you monitor in Prometheus?
The server publishes its metrics in Prometheus format on /metrics, prefixed with vllm:. The exact names changed with the move to the “V1” engine: check them by querying your own instance (curl localhost:8000/metrics) and the “Metrics” page of the documentation. The families to track:
- Load: running and waiting requests (
vllm:num_requests_running,vllm:num_requests_waiting). A growing queue is the first sign of saturation. - Memory: KV cache usage. Close to 100%, vLLM preempts requests and latency soars.
- Latency: histograms of time to first token (TTFT), inter-token time and end-to-end latency.
- Volume: counters of prompt tokens and generated tokens, the basis for throughput and cost calculations.
- Request outcome: number of requests finished by finish reason (maximum length, normal stop, abort).
These application metrics are read alongside GPU metrics: utilisation, memory, power and temperature, provided by NVIDIA’s DCGM exporter (deployed by the GPU Operator on Kubernetes) or by a host agent.
Logs and OpenTelemetry traces
vLLM logs to standard output the model loading, the memory allocated to the KV cache and, periodically, a summary of throughput and cache usage. On Kubernetes, these logs are collected like those of any other pod.
For traces, the server accepts an --otlp-traces-endpoint option that sends one span per request to an OTLP collector, with attributes inspired by the GenAI semantic conventions (model, tokens, time in queue, TTFT). The required OpenTelemetry packages must be installed separately; the documentation provides a complete example. If the calling application propagates W3C context, the vLLM span attaches to the end-to-end trace.
Sending vLLM data to Dynatrace
The simplest route is an OpenTelemetry Collector that scrapes /metrics, receives OTLP traces and exports everything. Dynatrace expects OTLP metrics with delta temporality: the cumulativetodelta processor converts cumulative Prometheus counters.
receivers:
  prometheus:
    config:
      scrape_configs:
        - job_name: vllm
          scrape_interval: 15s
          static_configs:
            - targets: ["vllm:8000"]
  otlp:
    protocols:
      grpc:
      http:
processors:
  cumulativetodelta:
  batch:
exporters:
  otlphttp:
    endpoint: https://<environment>.live.dynatrace.com/api/v2/otlp
    headers:
      Authorization: "Api-Token ${env:DT_API_TOKEN}"
service:
  pipelines:
    metrics:
      receivers: [prometheus]
      processors: [cumulativetodelta, batch]
      exporters: [otlphttp]
    traces:
      receivers: [otlp]
      processors: [batch]
      exporters: [otlphttp]
The token must carry metrics and traces ingest permissions. On Kubernetes, Dynatrace can also scrape annotated Prometheus endpoints directly; check its documentation to choose between the two approaches. Once the data is in Grail, a few dashboards are enough: p95 TTFT, waiting requests, KV cache usage, tokens per second and GPU utilisation per node. The principles of histogram-based SLOs, detailed in our article on histogram metrics with OpenPipeline, apply directly to TTFT.
Best practices
- Pin the vLLM version and the model identifier; test every upgrade, as options and metrics change.
- Protect the API with a key and network filtering; do not expose it directly on the internet.
- Alert on the queue and KV cache usage before latency: they are leading indicators.
- Size
--max-model-lenaccording to real usage rather than the model’s maximum capacity. - Keep prompts out of traces if they contain sensitive data.
Frequently asked questions
Is vLLM really compatible with the OpenAI API?
For the main endpoints (chat, completions, models, embeddings depending on the model), yes: you just change the SDK’s base URL. Some advanced parameters may differ; the documentation lists those that are supported.
Where can you find vLLM’s Prometheus metrics?
On the server’s /metrics path, on the same port as the API. Names start with vllm:.
Does vLLM work without a GPU?
A CPU mode exists for some platforms, but vLLM is designed for accelerators. Without a GPU, llama.cpp or Ollama are better suited.
Conclusion
vLLM provides the throughput needed to serve open LLMs at scale, and it has the good sense to be observable straight after installation. By bringing its Prometheus metrics, its OTLP traces and GPU metrics together in a single backend, you can run inference like any other critical service. To choose between vLLM and the other building blocks, see our comparison of self-hosted open source AI stacks.
span.observer is an independent community blog, not affiliated with Dynatrace LLC or the projects mentioned. Trademarks belong to their respective owners. Tools change quickly: check commands and options in their official documentation.


4 comments