
Your Java estate sends traces to APM Server with the Elastic APM agent, and Elastic now points users towards OpenTelemetry. To migrate Elastic APM agent to OpenTelemetry on the Java side, the documentation offers EDOT Java, Elastic’s OpenTelemetry distribution. The risk for an SRE team: silently losing custom spans or metrics, and breaking the alerts that depend on them.
This tutorial follows Elastic’s migration page: map the settings, keep a single endpoint, swap the -javaagent argument, then verify. It also lists what has no equivalent. The goal is to migrate one service at a time, with no visibility gap, and to end up with instrumentation that works with any OTLP backend.
Scope: Elastic Stack and Serverless Observability, according to the Elastic documentation read on 30 October 2026. The migration page shows no preview label and states Java 8 or later. It gives no specific EDOT Java version: check the version published on Maven Central before you deploy. This guide is not about Dynatrace Managed or SaaS, but the result is standard OpenTelemetry (see the end of the article).
Migrate Elastic APM agent to OpenTelemetry: what changes
The Elastic APM agent is a proprietary agent. EDOT Java is a distribution of the OpenTelemetry Java agent: automatic instrumentation with no code change, covering the libraries supported by upstream OpenTelemetry. Data leaves as OTLP and keeps the OpenTelemetry semantic conventions. For the OpenTelemetry metrics bridge, Elastic states that attribute names keep their dots instead of turning into labels.* fields.
In practice, JVM metric names change, some settings disappear, and the Elastic agent API (manual spans) must be replaced if you used it. To understand where this data should go, read OTLP APM Server or EDOT Collector first.
Prerequisites
- Java 8 or later (EDOT Java migration page).
- An OTLP entry point: an EDOT Collector, an Elastic Managed OTLP endpoint (Serverless) or an endpoint of your deployment. For a local Collector, the configuration page cites
http://localhost:4318with no authentication. - An Elastic API key or secret token if the entry point requires authentication. Never commit them to a repository.
- The
co.elastic.otel:elastic-otel-javaagentagent, downloaded from Maven Central. - The list of
ELASTIC_APM_*settings of your current services: this is your starting point.
Step 1: migrate manual instrumentation
Optional according to Elastic, but critical: if your code calls the Elastic APM agent API to create transactions or spans, move to the OpenTelemetry annotations and API. Otherwise those custom spans are no longer generated. Inventory them before the switch: a missing span can erase the detail behind a latency SLI.
Step 2: translate the settings
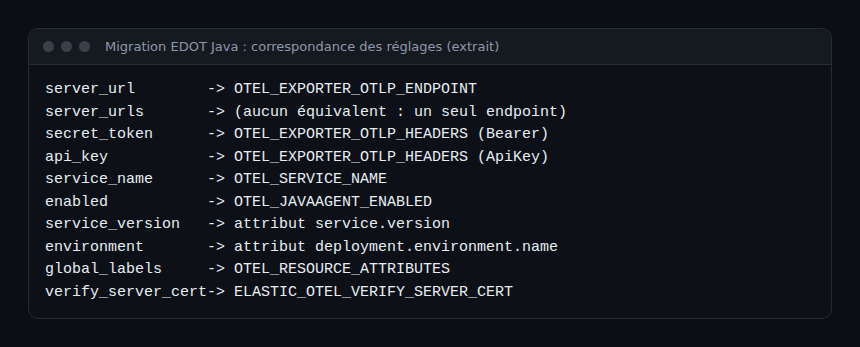
The migration page provides a mapping table. Here is the essentials:
| Elastic APM agent | EDOT Java / OpenTelemetry |
|---|---|
server_url |
OTEL_EXPORTER_OTLP_ENDPOINT |
secret_token |
OTEL_EXPORTER_OTLP_HEADERS with Authorization=Bearer … |
api_key |
OTEL_EXPORTER_OTLP_HEADERS with Authorization=ApiKey … |
service_name |
OTEL_SERVICE_NAME or the service.name attribute |
service_version |
resource attribute service.version |
environment |
resource attribute deployment.environment.name |
global_labels |
key=value pairs in OTEL_RESOURCE_ATTRIBUTES |
disable_instrumentations |
OTEL_INSTRUMENTATION_<name>_ENABLED=false |
log_sending |
on by default; set otel.logs.exporter to none to turn it off |
verify_server_cert |
ELASTIC_OTEL_VERIFY_SERVER_CERT (default true) |
Other settings exist (trace_methods, capture_headers, capture_jmx_metrics, service_node_name…) with different syntaxes: see the full page. Two nuances: trace_methods becomes OTEL_INSTRUMENTATION_METHODS_INCLUDE with a different syntax and fewer wildcards, and header capture is static at startup, whereas it used to be dynamic.
Step 3: a single endpoint
The server_urls setting (several servers) has no equivalent: EDOT Java accepts one endpoint only. For multiple destinations, put a Collector in front of your services and handle the export there. See the OpenTelemetry Collector on Kubernetes and Elastic Agent as an OpenTelemetry collector.
The documentation’s minimal configuration is three variables:
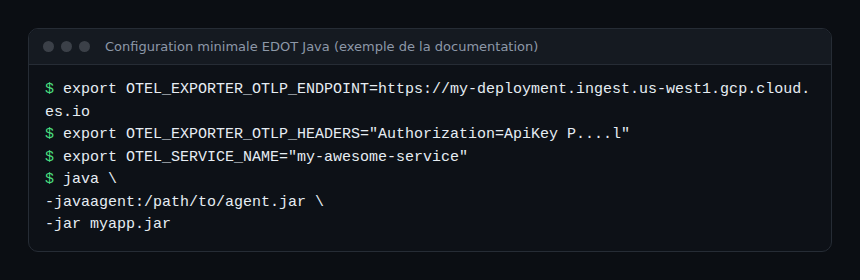
export OTEL_EXPORTER_OTLP_ENDPOINT=https://my-deployment.ingest.us-west1.gcp.cloud.es.io
export OTEL_EXPORTER_OTLP_HEADERS="Authorization=ApiKey P....l"
export OTEL_SERVICE_NAME="my-awesome-service"
According to the configuration page, OTEL_SERVICE_NAME is required for UI integration and correlation, and OTEL_EXPORTER_OTLP_ENDPOINT is mandatory unless a Collector answers on http://localhost:4317, the default address.
Step 4: swap the javaagent
Replace the Elastic APM agent’s -javaagent argument with the EDOT one, then restart:
java \
-javaagent:/path/to/agent.jar \
-jar myapp.jar
If you cannot change the command line, JAVA_TOOL_OPTIONS works, but Elastic warns that it applies to every JVM process in the same environment, build tools included. Prefer the server’s startup script: CATALINA_OPTS in bin/setenv.sh for Tomcat, for instance. On Kubernetes, the documentation points to the OpenTelemetry Operator. Also remove the ELASTIC_APM_* variables you no longer need.
What has no equivalent
The migration page lists the losses. Read it with your dashboards open.
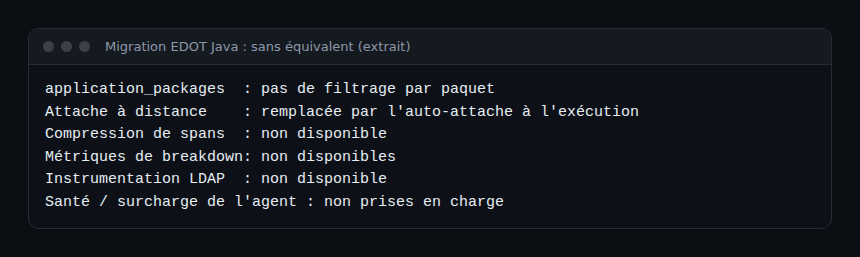
server_urls: a single endpoint.application_packages: no stack filtering by package.- Remote attach: replaced by runtime self-attach, with limitations.
- Span compression and breakdown metrics: not available.
- LDAP client instrumentation: not available.
- Agent health and overhead, cgroup metrics: not supported; use
hostmetricsreceiverorkubeletstatsreceiverin the Collector.
On metrics, JVM names follow the OpenTelemetry conventions: for example jvm.gc.time becomes jvm.gc.duration, and memory goes through jvm.memory.used with a jvm.memory.type attribute. jvm.gc.count has no direct equivalent. Rewrite the queries and alerts that rely on the old names. Micrometer instrumentation is off by default; enable it with otel.instrumentation.micrometer.enabled=true.
How to check that it works
- Set the agent log level to
DEBUGwithELASTIC_OTEL_JAVAAGENT_LOG_LEVEL: the documentation recommends it for troubleshooting and it prints spans as JSON. - Check in Elastic’s Observability interface that the service appears under the right name, with the expected version and environment.
- Compare throughput and p95 latency before and after on the first migrated service.
- Confirm that migrated manual spans exist and that alerts were rewritten with the new metric names.
Best practices
- Migrate a pilot service, then go in waves: incident MTTR is shorter when only one variable changes at a time.
- Keep the old agent running in a test environment to compare results.
- Keep secrets out of the repository, in your secrets manager.
- Only disable
ELASTIC_OTEL_VERIFY_SERVER_CERTfor a trial: Elastic recommends adding the authority to the JVM trust store instead. - Standardise on OTLP: for the shared-standard logic, see OpenTelemetry and Prometheus.
And with Dynatrace?
EDOT Java remains an OpenTelemetry agent: it emits standard OTLP. Dynatrace accepts OTLP, but this article did not test that path and the Elastic documentation does not cover it: do not assume it. To compare vendor approaches, read Dynatrace vs Datadog.
Frequently asked questions
Do I need to migrate manual instrumentation code?
Elastic marks this step as optional, but states that transactions and spans created with the Elastic agent API are no longer generated until they are migrated to the OpenTelemetry API.
Can I keep several servers with server_urls?
No, the migration page says there is no equivalent: a single endpoint. Use a Collector to split or duplicate the data.
Will my JVM metric dashboards keep working?
Not as they are. Several metrics are renamed and some have no direct equivalent. Rewrite them using the list on the migration page.
Conclusion
To migrate the Elastic APM agent to OpenTelemetry with EDOT Java, do four things: inventory instrumentation code, translate the settings, target a single endpoint, swap the -javaagent. The real losses are in the “no equivalent” list: read it before the first deployment. Sources: EDOT Java migration, setup, configuration.
This site is an independent blog, not affiliated with Dynatrace LLC or Elastic N.V. Elastic information comes from its public documentation, read on 30 October 2026; check it for your version.