




Metric cardinality never shows up on a dashboard. It shows up on next month’s bill, or in a Prometheus server that keeps restarting because it ran out of memory. This guide starts from a practical operations decision: before a team ships a new metric, what should you check, and how do you spot a series that is exploding once it is already in production?
The method has four moves: put a number on a metric before it ships, audit a block of data with promtool, alert on the rate at which new series appear, then cap the damage at the source in the OpenTelemetry SDK. It complements the guide on Kubernetes metrics cardinality, which centres on the TSDB API and kube-state-metrics, and does not repeat it.
In brief
- A metric’s series count is at most the product of the number of values of each label: work it out before release.
promtool tsdb analyzeaudits a block offline and ranks the hungriest labels.scrape_series_addedlets you alert on new series, andpromtool test rulestests the alert without a server.- The OpenTelemetry SDK can filter attributes (
attribute_keys) and cap data points, with an overflow point.
Put a number on metric cardinality before code review
The Prometheus instrumentation best practices advise keeping the cardinality of a metric below 10 and, beyond that, limiting such metrics to a handful across the whole system. They suggest looking for another solution when a metric goes over 100. These are guidelines, not bans, but they give a useful order of magnitude in review.
The arithmetic is simple. A metric with the labels route (4 values), status (3 values) and user_id (1,000 values) can reach 4 × 3 × 1,000 = 12,000 series. The third label carries the whole cost. So add one question to your pull request template: what values can each label take, and what bounds their number?
The Prometheus naming page is explicit: do not store high-cardinality dimensions such as user IDs or email addresses in labels. An identifier belongs in a trace or a log, not in a metric.
Audit a block with promtool tsdb analyze
The TSDB status API queries a running server. promtool offers the other option: analyse a data directory, for example a copy of a block taken from a server or a snapshot, without touching production. The command is tsdb analyze, described officially as “Analyze churn, label pair cardinality and compaction efficiency”.
To keep the example reproducible, I built a laboratory dataset: one http_requests_total metric with 12 legitimate series (4 routes, 3 statuses) and 400 series that also carry a user_id label. The OpenMetrics file is converted to blocks, then analysed.
promtool tsdb create-blocks-from openmetrics m.om ./db
promtool tsdb analyze ./db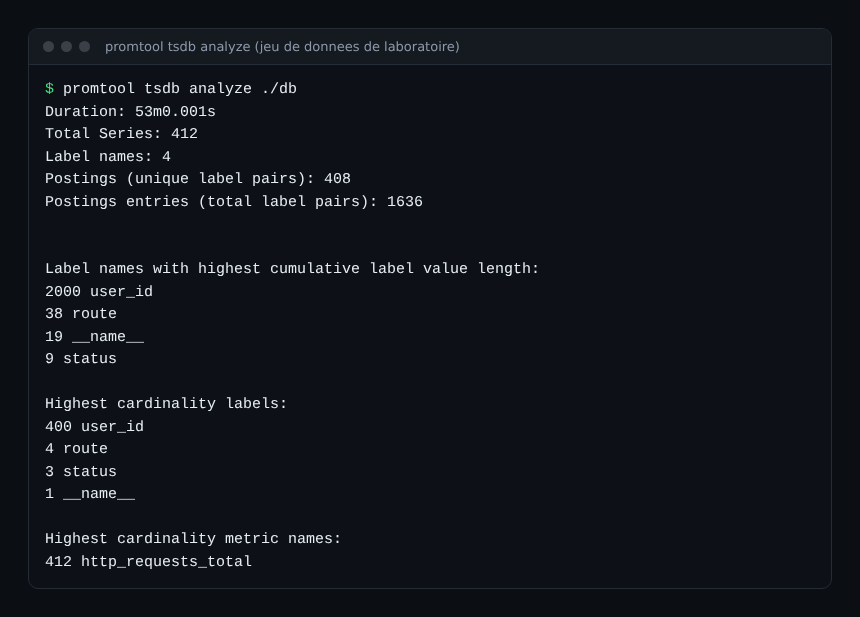
Read it from the bottom up. “Highest cardinality metric names” names the culprit metric, “Highest cardinality labels” the label (here user_id, 400 values against 4 for route), and “Label names with highest cumulative label value length” shows where memory goes, because value length counts. The same output also contains “Label pairs most involved in churning”, useful for spotting values that are born and die constantly. In my dataset every value is 0: the data is stable, which a cluster that redeploys is not.
Spot exploding series with scrape_series_added
A one-off audit is not enough: the explosion comes after a deployment, on a Thursday at 5 pm. Prometheus generates diagnostic series for every scrape. According to the “Jobs and instances” documentation, scrape_series_added is the approximate number of new series in the scrape, scrape_samples_scraped the number of samples the target exposed, and scrape_samples_post_metric_relabeling the number left after relabelling.
A healthy job creates few new series per scrape, apart from during redeployments. An alert on this signal warns you before memory runs out:
groups:
  - name: cardinalite
    rules:
      - alert: SeriesNouvellesParScrape
        expr: scrape_series_added > 500
        for: 10m
        labels:
          severity: warning
The threshold of 500 is an example: measure your jobs’ normal level before fixing it. Then test the rule without a server, using a test file that injects values:
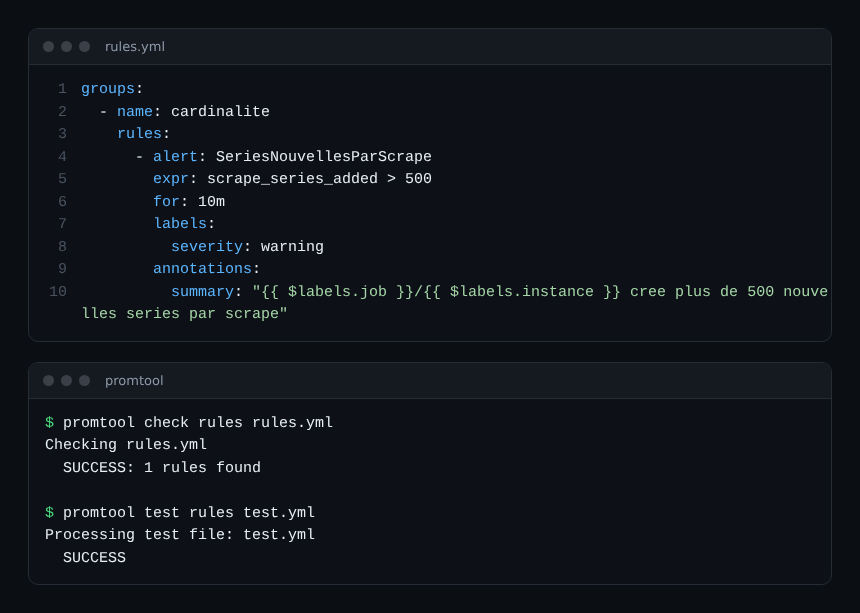
The test injects the scrape_series_added series at 10 for five minutes, then at 900, and checks that the alert is firing after 30 minutes. An alert that has never been tested is a gamble, especially with a for clause.
Cap metric cardinality at the source with OpenTelemetry
Fixing things in Prometheus is reactive. The OpenTelemetry SDK lets you decide before export. The metrics SDK specification defines an aggregation cardinality limit: if no other value is defined, 2000 is used. Beyond it, measurements go into an overflow set carrying the boolean attribute otel.metric.overflow set to true. A View can also set aggregation_cardinality_limit for an instrument, or filter attributes with attribute_keys. According to the specification, the limit is enforced after attribute filtering, so filtering first helps you stay under the cap.
I checked the behaviour with the Python SDK (opentelemetry-sdk 1.45.2): a counter receives 3,000 measurements, each with a different user.id attribute.
View(instrument_name="app.requests", attribute_keys={"http.route"})
View(instrument_name="app.requests", aggregation_cardinality_limit=100)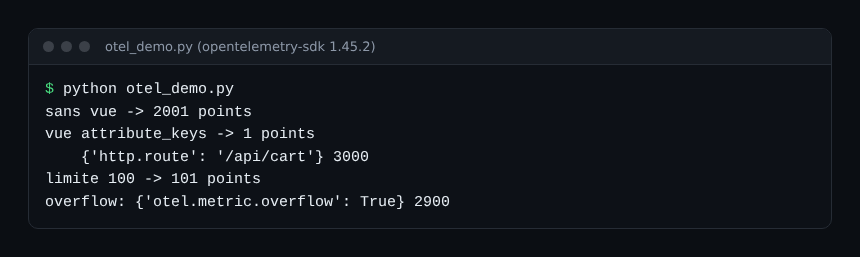
With no view you get 2,001 points: the default limit of 2,000 plus the overflow point. With attribute_keys, a single point remains holding all the measurements (3,000). With a limit of 100 you get 101 points, and the overflow accumulates the remaining 2,900 measurements. The overflow keeps the total but loses the detail. A cap limits the damage, but only removing the attribute solves the problem. I have not verified these options in other languages: availability varies by SDK.
To place the two ecosystems side by side, see OpenTelemetry and Prometheus as complementary tools.
Best practices: a five-line review guardrail
- List the possible values of each label in the pull request and multiply.
- Refuse any identifier (user, request, session) as a metric label or attribute.
- Set
sample_limiton jobs, knowing that exceeding it fails the whole scrape. - Alert on
scrape_series_addedand test the rule withpromtool test rules. - Replay
promtool tsdb analyzeevery quarter on a recent block.
The same reasoning applies to logs: the article on Loki labels and cardinality covers the equivalent for a log index, and the one on Datadog custom metrics shows how billing is computed at one vendor. On the operations side, alerting on nodes, pods and quotas remains a separate matter.
Sources: Prometheus instrumentation best practices, OpenTelemetry metrics SDK specification.
Frequently asked questions
What cardinality is acceptable for a metric?
The Prometheus documentation gives guidelines: under 10 values per metric, only a few metrics above that, and a rethink of the dimensions beyond 100. The right threshold depends on your series budget, which you have to measure.
What happens when the OpenTelemetry SDK limit is reached?
New attribute combinations are aggregated into a single point carrying otel.metric.overflow=true. The total stays exact, but the per-attribute detail is lost for those measurements.
Should I use sample_limit to protect myself?
It is a useful safety net but a blunt one: according to the documentation, if the number of samples after relabelling exceeds the limit, the entire scrape is treated as failed. Combine it with the alert on new series.
Conclusion
Controlling metric cardinality means moving control earlier: count in review, audit with promtool, alert on the rate of series creation, cap in the SDK. The outputs shown come from a laboratory dataset, not a production environment: repeat the measurements on your own data before fixing thresholds.
span.observer is an independent blog, not affiliated with Dynatrace LLC. Product names mentioned belong to their respective owners; configurations are examples to adapt and test before any production use.