Multidimensional analysis in Dynatrace Managed answers a question that builtin metrics cannot ask on their own: which endpoint, for which customer, since which release, is degrading my service? It splits the requests of one or more services by the dimensions you choose, filters out what does not matter, then turns the view into a calculated metric you can alert on.
For an SRE team, this is the tool that shortens MTTR between “response time is rising” and “it is POST /checkout for the B2B customer since the 2 pm deployment”. Without it, you open dozens of traces at random.
This guide applies to Dynatrace Managed (classic services, OneAgent). It covers the step-by-step setup, concrete scenarios, every view setting, the pitfalls and the move to alerting.
What multidimensional analysis in Dynatrace Managed does
The Multidimensional analysis view analyses the web requests of your services with fine-grained filtering. Three predefined views ship with it: Top web requests (most frequent and most expensive requests), Top database statements (the same logic for SQL statements) and Exception analysis (code-level exceptions). You can also build your own view with Create analysis view.
The key point: the data source is not a metric but trace and request data (distributed traces). The practical consequence, detailed below, is that values can differ from those in Data Explorer.
Prerequisites
- A Dynatrace Managed environment with services detected by OneAgent.
- To split by business data (customer, plan, country): configured request attributes.
- For API automation: a token with the
WriteConfigscope (calculated metrics),settings.write(metric events through Settings 2.0) andmetrics.read(Metrics v2 queries).
Configure a view step by step
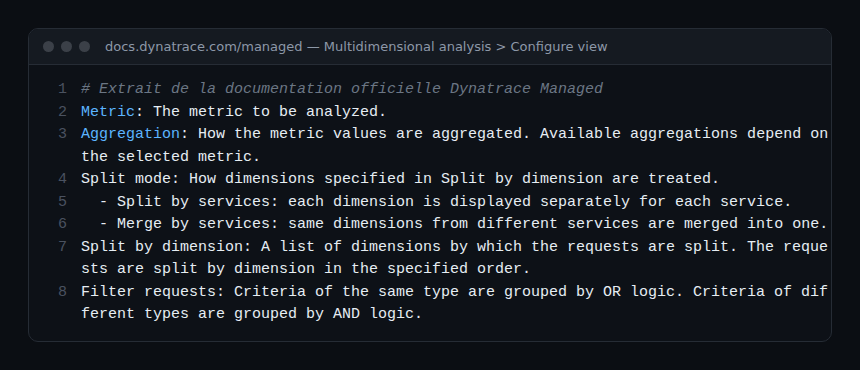
- Open Multidimensional Analysis, then pick a predefined view or Create analysis view.
- In Metric, choose the measure (response time, request count, failure rate…).
- In Aggregation, choose the aggregation; the list depends on the selected metric. For latency, prefer a percentile over the average.
- In Split by dimension, add one or more dimensions. Place your cursor in the field to see the options. Order matters: requests are split in the order given.
- Set Split mode: Split by services shows each dimension separately for each service; Merge by services merges identical dimensions from different services.
- In Filter requests, narrow the scope. Criteria of the same type combine with OR, criteria of different types with AND.
- The view refreshes on every change. Save it with Save view and a clear name.
The chart shows the top 15 dimensions (the rest are aggregated into a single series); the table beneath lists up to 85 more, 100 in total. In the Actions column, Filter narrows the view to one row and More (…) opens the Analyze menu.
Concrete scenarios and useful combinations
Response time per endpoint
Response time metric, 90th percentile aggregation, split by request name, Split by services mode. The table ranks the slowest endpoints; then filter on the most expensive one and open its traces from the Analyze menu. To separate reads from writes, add the HTTP method as a second dimension.
Errors per customer
First create a request attribute (customer or tenant identifier, captured from an HTTP header or a parameter). Then: failed request count metric, split by that request attribute, filter on the front-end service. You see whether the incident hits everyone or a single customer, which changes priority and communication.
Regression after a release
If the application version is exposed as a request attribute or a tag, put it first and the request name second. Compare the latency of the same endpoint across both versions over the same window. The Analyze menu also offers Comparison to go further.
Comparing periods
Save the view, then replay it over two timeframes (the day before go-live, the day after). Keep exactly the same filters, otherwise you compare two different populations. Beyond 10 days, turn on Show data retention to see which data is still available for each period.
SQL statements and exceptions
Start from Top database statements for slow or overly frequent queries (the classic N+1), and from Exception analysis to tie a rising failure rate to an exception class.
Filters and dimensions: what to know
- Filter logic: two HTTP codes in the same filter = either one (OR); an HTTP code plus a service = both at once (AND). To exclude health checks, filter them out explicitly rather than letting them skew the median.
- Request attributes: key/value pairs attached to a request, captured from web request data (headers, GET/POST parameters, URL, client IP), Java, .NET or PHP method arguments, or the OneAgent SDK. Limits: 100 attributes per request, 10 values per attribute per request. Mark those holding personal data as confidential.
- Dimension order: put the low-cardinality dimension first (method, status class), the finest one after.
- Export: Export produces a CSV of displayed, visible or all data, up to 100 dimensions.
Create a calculated metric and an alert
A view that helps during an incident often deserves to become a permanent signal. From Create analysis view, optionally pick a management zone, configure the view, then in the View pane select Create metric. Give it a name: it is added to the key, prefixed with calc:service.. The key cannot be changed afterwards. Advanced options gives access to fine-tuning.
The same operation exists in the API (endpoint /api/config/v1/calculatedMetrics/service, scope WriteConfig), handy for versioning configuration:
curl -X POST "https://{your-domain}/e/{your-environment-id}/api/config/v1/calculatedMetrics/service" \
  -H "Authorization: Api-Token $DT_TOKEN" \
  -H "Content-Type: application/json" \
  -d @calc-metric.json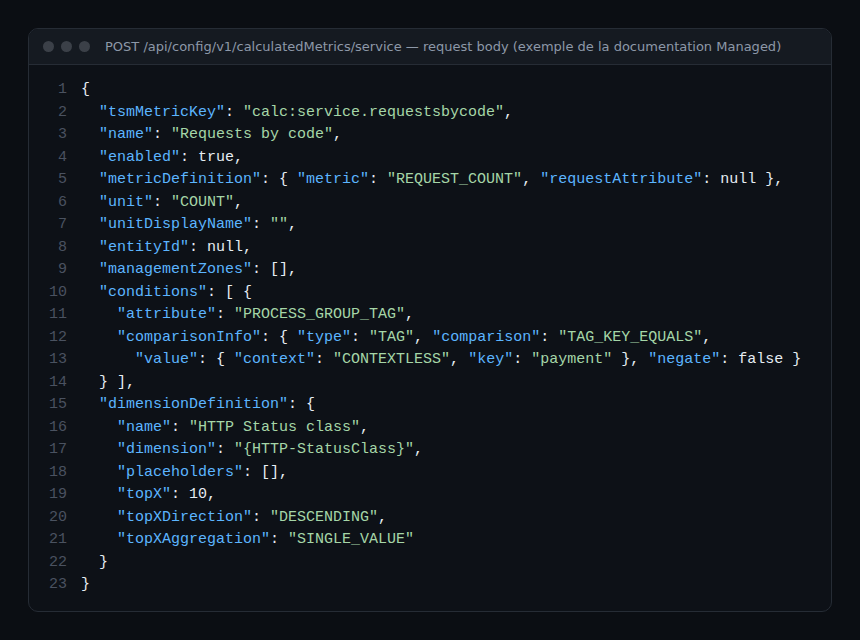
To alert, go to Settings > Anomaly detection > Metric events and create a metric event on your calc:service.* key. The Metric key type only accepts a static threshold; the Metric selector type adds the auto-adaptive threshold and the seasonal baseline.
From split to alert in 5 steps
Here is the full path from the analysis view to the Davis event, with the matching screens and API fields. Every step applies to Dynatrace Managed.
- Choose the metric. In Multidimensional Analysis > Create analysis view, pick a measure that exists in the API Metric list (
REQUEST_COUNT,RESPONSE_TIME,FAILURE_RATE,HTTP_5XX_ERROR_COUNT…). A count aggregates cleanly; a response time is read as a percentile. - Split by dimension or request attribute. In Split by dimension, put the bounded dimension first (HTTP status class, method), then the business dimension captured as a request attribute (customer, plan). Each combination becomes a series: the split decides the cost of step 4.
- Filter. In Filter requests, keep the relevant service or management zone and drop health checks. Reminder: same criterion type = OR, different types = AND.
- Create metric. In the View pane, Create metric sets the name and the
calc:service.*key; Advanced options opens Number of top values, Value sorting and Value aggregation (in the API:topX,topXDirection,topXAggregation). The metric can then be queried like any other through the metric selector. - Metric event. In Settings > Anomaly detection > Metric events > Add metric event, choose Metric key for a static threshold on the key, or Metric selector for an auto-adaptive threshold or a seasonal baseline. Set the sliding window (up to 60 one-minute samples), a query offset if the metric arrives late, and a readable title using the
{metricname},{threshold}and{dims}placeholders.
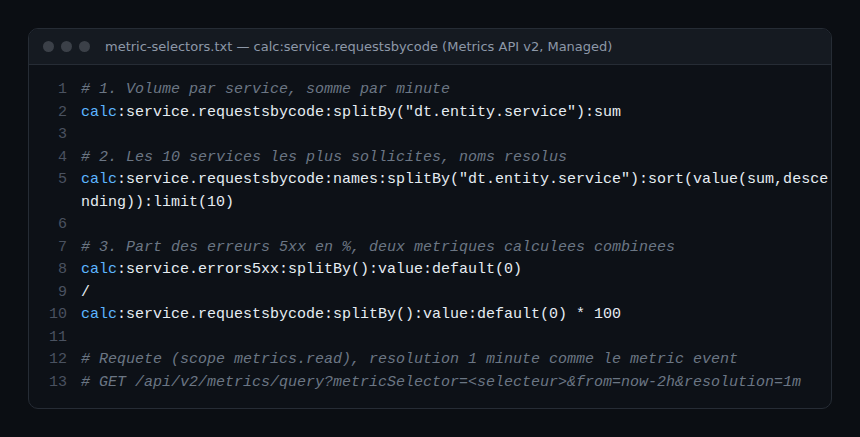
The same metric event can be versioned through the Settings 2.0 API: a POST /api/v2/settings/objects (scope settings.write) with the builtin:anomaly-detection.metric-events schema and the environment scope. The queryDefinition, modelProperties and eventTemplate fields mirror the three blocks of the screen exactly. Add ?validateOnly=true to test the body without creating anything.
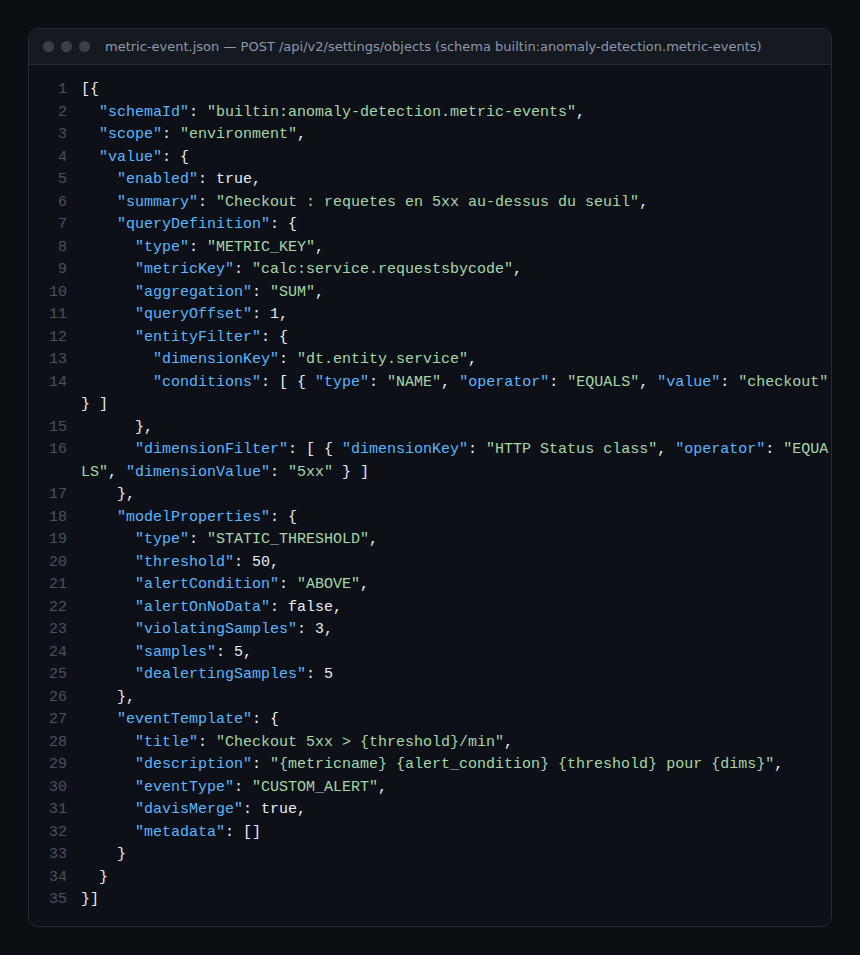
The metric event does not tell you where the error comes from: to walk the call chain back from the alerted service, continue with the service backtrace and the Smartscape topology.
Limits: metric quota, cardinality and cost in Managed
- Calculated metric quota: 500 enabled calculated metrics per environment and 100 per service. Beyond that, you must disable or delete before creating. Keep an inventory with
GET /api/config/v1/calculatedMetrics/serviceand remove the ones no dashboard, SLO or metric event reads. - Cardinality: at most 100 dimension values (the “top X” rule); the rest goes into the
remainderdimension, which you can filter withremainder("dimension")in the metric selector. A unique identifier (customer, session) as a dimension saturates this limit within minutes and leaves only an aggregate. On the request attribute side, OneAgent captures at most 100 attributes and 10 values per attribute for one request, and 1,000 attributes for a whole distributed trace. - Cost in Managed: under the classic licence, a calculated metric is a custom metric that consumes Davis data units (DDUs): 0.001 DDU per data point, so 525.6 DDUs per year for a series written every minute, and every dimension value is a series. Calculated metrics are not eligible for the metrics included per host unit. The Settings > Server-side service monitoring > Calculated service metrics screen shows a DDU consumption estimate in Preview before you save. Under DPS this calculation no longer applies: check your cluster’s licence model.
- Metric event limits: 10,000 configurations per environment; a Metric key event is throttled at 200 simultaneous alerts; a Metric selector event monitors at most 1,000 dimensions (500 with a seasonal baseline), with 100 selectors per strategy. Exceeding them shows up as
THROTTLEDin the metric events overview. - Deprecated conditions: the API documentation notes that the
PROCESS_GROUP_TAGcondition is “no longer evaluated” in phase 3 environments and thatSERVICE_TAGis not supported there. Prefer a condition on a service attribute (SERVICE_DISPLAY_NAME,WEBREQUEST_URL_PATH) or a management zone.
Pitfalls to avoid
- Sampling: over long timeframes or without filters, only a fraction of traces is used. Hover over Refine to see how much data is included, select it to include more. Below two hours, resolution drops under one minute.
- Gap with Data Explorer: traces on one side, metrics on the other. Do not compare both figures to the decimal.
- No backfill: a calculated metric only records new data. Create it before you need it.
- Limits: 500 enabled calculated metrics per environment, 100 per service, at most 100 dimension values; details, cardinality and DDU cost in the previous section.
Best practices
- Name saved views after the question (“p90 checkout per customer”), not after their author.
- Only promote to a metric the views reviewed in a blameless retrospective: each metric uses a slot within the limits.
- Split by a bounded dimension (status class, plan) rather than a unique identifier.
- Tie the calculated metric to an SLO or a metric event, otherwise it only feeds the archive.
How to check that it works
After creation, search for the calc:service. key in Data Explorer: data points appear from the creation time onwards, not before. Compare the order of magnitude with the analysis view over the same short window, and check that the metric event appears in the metric events overview without a QUERY_FAILED or THROTTLED status.
To go further: builtin service metrics in Managed, the metric selector and alerts, creating an SLO in Managed and how to reduce alert noise. The official reference: Multidimensional analysis and Calculated metrics for services.
To drill down from an aggregated chart to an individual request, continue with distributed traces and PurePath.
Frequently asked questions
Why do my figures differ from Data Explorer?
Multidimensional analysis relies on traces and requests, sampled at high volumes, whereas Data Explorer reads metrics. Shorten the window or add filters, then use Refine.
Can I split by business data?
Yes, provided you capture it as a request attribute (header, parameter, method argument or OneAgent SDK). It then becomes a split dimension and a filter criterion.
Does the calculated metric include history?
No. Only new data is written. For history, go back to the analysis view, within trace retention.
Conclusion
Multidimensional analysis turns a vague alert into a precise hypothesis: one endpoint, one customer, one release. Set up a few reference views, save them, and promote the most useful ones to calculated metrics wired to alerts. The next incident will start with the right question.
span.observer is an independent community blog, not affiliated with Dynatrace LLC. Dynatrace is a trademark of its owner. Screen and field names may vary by version: check them in the official documentation.