Self-hosted Open WebUI is the most widely used chat interface for giving a team a ChatGPT-like experience while keeping data in-house. It sits in front of Ollama or any OpenAI-compatible API, such as a vLLM or llama.cpp server, and adds what a bare inference engine lacks: user accounts, conversation history, document management and model selection.
It is one of the most-followed open source projects on GitHub in its field, and it is often the first visible building block of an internal AI platform. That visibility has a direct consequence for operations teams: when the interface is slow, users cannot tell whether the problem lies in the browser, the application, the document search or the model. You need to be able to answer quickly.
Let’s look at what Open WebUI offers, how to install it in a few minutes with Docker, and then how to monitor it: logs, health probe, OpenTelemetry export and correlation with the inference engine in a tool such as Dynatrace.
What does self-hosted Open WebUI do?
Open WebUI is a web application (Python backend, Svelte frontend) that provides:
- a multi-model chat interface, with history, folders and sharing;
- user and role management, with an administrator who controls which models are available;
- connections to Ollama and to OpenAI-compatible APIs, configurable in the admin interface;
- a built-in RAG feature: you attach documents or knowledge bases that the model consults during the conversation;
- extension mechanisms (tools, functions, pipelines) to add behaviour in Python.
Limits to keep in mind: Open WebUI is not an inference engine. Its performance depends on the model backend and, for RAG, on the embedding model and the vector store. Its licence has also changed across versions, with a clause on branding: read it before a large-scale or white-label deployment.
In practice: installing Open WebUI in front of Ollama
Step 1 — Have a model backend
The simplest case is Ollama running on the host, on port 11434. Our guide Ollama locally describes how to install it. Check that it responds:
curl -s http://localhost:11434/api/tagsStep 2 — Start the container
The official documentation suggests a command like this one, which publishes the interface on port 3000 and keeps the data in a volume:
docker run -d --name open-webui --restart always \
  -p 3000:8080 \
  --add-host=host.docker.internal:host-gateway \
  -e OLLAMA_BASE_URL=http://host.docker.internal:11434 \
  -v open-webui:/app/backend/data \
  ghcr.io/open-webui/open-webui:main
Other image variants exist (with Ollama bundled, with CUDA support). Installing with pip is also possible. The exact tags and commands are in the Open WebUI documentation.
Step 3 — Create the administrator account
Open http://localhost:3000: the first account created becomes the administrator. In the admin settings, check the connection to Ollama, choose which models are visible and decide whether new sign-ups are open, pending approval or closed.
Step 4 — Add an OpenAI-compatible API
To connect a vLLM or llama.cpp server, add an OpenAI connection in the admin settings, or pass the URL and key at start-up:
-e OPENAI_API_BASE_URL=http://vllm.interne:8000/v1 \
-e OPENAI_API_KEY=vllm-server-key
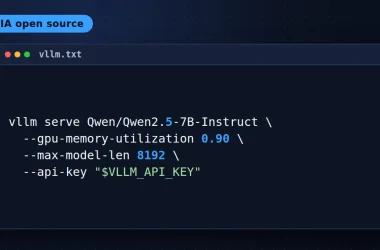
The models exposed by that server then appear alongside Ollama’s. See vLLM in production for the server side.
Step 5 — Prepare for production
For shared use, set a stable secret key for sessions (the WEBUI_SECRET_KEY variable), put the application behind a TLS reverse proxy, connect corporate authentication (OIDC is supported) and consider PostgreSQL instead of the default SQLite database. Back up the data volume: it holds accounts, conversations and documents.
How do you monitor Open WebUI?
Health and availability
The backend exposes a /health endpoint that a Kubernetes probe, a Docker healthcheck or an HTTP synthetic monitor can use. A browser monitor that logs in and opens a conversation also tests the real user journey.
Logs
docker logs -f open-webuiThe level of detail is set through environment variables (a global level and per-component levels). The logs show calls to the model backends, connection errors and document processing for RAG. Avoid debug level in production: it can contain extracts of conversations.
OpenTelemetry traces and metrics
Recent versions of Open WebUI include OpenTelemetry instrumentation, enabled through environment variables: a general enable flag, then one flag per signal (traces, metrics, logs, all off by default) and the standard OTLP endpoint. An indicative example, to check against the “Observability” page of the documentation:
-e ENABLE_OTEL=true \
-e ENABLE_OTEL_TRACES=true \
-e OTEL_EXPORTER_OTLP_ENDPOINT=http://otel-collector:4317 \
-e OTEL_SERVICE_NAME=open-webui
You get spans for the backend’s HTTP requests and its outbound calls (database, HTTP client towards the models). If the inference engine also emits traces, as vLLM does, W3C context propagation lets you follow a question from the interface all the way to the GPU.
Correlating the interface and the model in Dynatrace
The OpenTelemetry Collector receives Open WebUI’s traces and sends them to the Dynatrace OTLP endpoint with an API token. In parallel, OneAgent or the Collector gathers the container logs and host metrics, and the model backend’s metrics arrive through their own path. In the distributed traces you can then separate the time spent in the application, in document search and in generation. The method is the one from our article end-to-end OpenTelemetry, applied to an AI user journey.
Useful indicators: /health availability, chat request latency, error rate towards each model backend, document indexing time, number of active users.
Best practices
- Close public sign-ups or require administrator approval.
- Pin an image version rather than
mainin production, and read the release notes before every update. - Define a conversation retention policy and inform users.
- Enable OpenTelemetry on both the interface and the inference engine to get end-to-end traces.
- Back up the data volume and the database regularly.
Frequently asked questions
Does Open WebUI work without Ollama?
Yes. You just configure one or more connections to OpenAI-compatible APIs (vLLM, llama.cpp, a hosted service); Ollama is optional.
Can you connect corporate authentication?
Yes, Open WebUI supports OIDC and other mechanisms described in its documentation, as well as group and permission management.
Does Open WebUI export OpenTelemetry traces?
Recent versions do, through environment variables. Check the exact names in the documentation for your version.
Conclusion
Open WebUI turns an inference engine into a service a whole team can use. It is also the first place where users notice a problem: instrument it from day one and link it to the model engine so you know where the time goes. To assemble the whole stack, read our comparison of self-hosted open source AI stacks.
span.observer is an independent community blog, not affiliated with Dynatrace LLC or with the projects mentioned. Trademarks belong to their respective owners. Tools change quickly: check commands and options in their official documentation.