
Module 4 of the Dynatrace Managed metrics course: builtin application metrics for web and mobile RUM (Apdex, user actions, Core Web Vitals, errors, crashes) and for synthetic monitors, in 23 entries with the exact key, unit, use case and a ready-to-paste selector.
Learning path: Dynatrace Managed metrics training · Module 4/7 · Type: reference · Platform: Dynatrace Managed (classic metrics)
In this module:
- a summary table of the 23 keys, to keep at hand
- one entry per metric: what it measures, when to use it, the pitfall to avoid
- a metric selector per entry, testable in Data Explorer
The previous modules look at the system from the inside: hosts, services, databases. This module looks from the user’s side. RUM measures what real visitors experience in their browser or mobile app; synthetic monitoring replays a journey at a fixed interval, even at night when nobody logs in. Together, they provide the SLIs closest to what customers feel.
Everything below applies to Dynatrace Managed: builtin:apps.* and builtin:synthetic.* keys, metric selector, Metrics API v2 and Data Explorer. There is no Grail or DQL here. On Dynatrace SaaS with Grail, RUM and synthetic use different keys; they are covered in the SaaS metrics course.
This module extends module 3 on services: a slow user action is often read alongside the service it calls. For the setup, see RUM and Core Web Vitals and HTTP and browser synthetic monitoring.
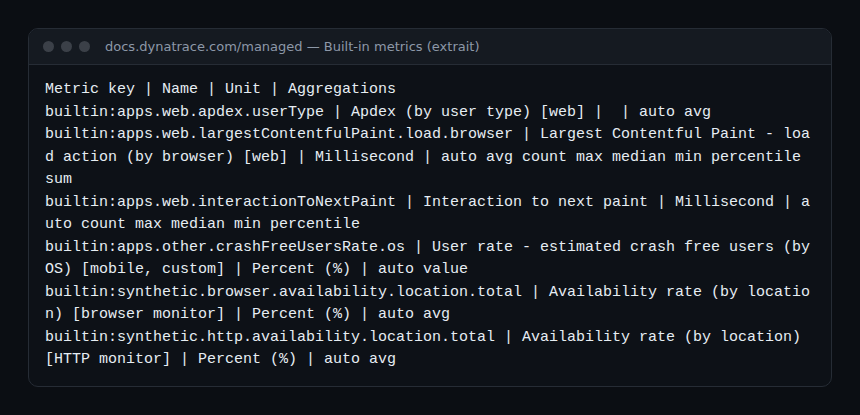
Builtin application metrics in one table
Every key, unit and aggregation below comes from the official list of Dynatrace Managed built-in metrics. The “Scope” column reflects the documentation label ([web], [mobile, custom], [browser monitor], [HTTP monitor]); exact dimensions are listed in each metric’s descriptor. An empty unit means a unitless score.
| Key | Unit | Aggregations | Scope | What it measures |
|---|---|---|---|---|
builtin:apps.web.apdex.userType |
(score) | avg | Web | Apdex of user actions, by user type |
builtin:apps.web.actionCount.load.browser |
Count | value | Web | Number of load actions, by browser |
builtin:apps.web.actionDuration.load.browser |
Millisecond | avg, count, max, median, min, percentile, sum | Web | Duration of load actions |
builtin:apps.web.actionDuration.xhr.browser |
Millisecond | avg, count, max, median, min, percentile, sum | Web | Duration of XHR actions |
builtin:apps.web.visuallyComplete.load.browser |
Millisecond | avg, count, max, median, min, percentile, sum | Web | Time to fully render the viewport |
builtin:apps.web.largestContentfulPaint.load.browser |
Millisecond | avg, count, max, median, min, percentile, sum | Web | Largest Contentful Paint (LCP) |
builtin:apps.web.cumulativeLayoutShift.load.browser |
(score) | avg, count, max, median, min, percentile, sum | Web | Cumulative Layout Shift (CLS) |
builtin:apps.web.interactionToNextPaint |
Millisecond | count, max, median, min, percentile | Web | Interaction to Next Paint (INP) |
builtin:apps.web.activeSessions |
Count | value | Web | Estimated active sessions |
builtin:apps.web.bouncedSessionRatio |
Percent (%) | value | Web | Bounce rate |
builtin:apps.web.countOfErrors |
Count | value | Web | Detected errors, by type and origin |
builtin:apps.web.jsErrorsDuringUa |
Count | value | Web | JavaScript errors during a user action |
builtin:apps.web.percentageOfUserActionsAffectedByErrors |
Percent (%) | value | Web | % of user actions affected by an error |
builtin:apps.other.apdex.osAndVersion |
(score) | value | Mobile, custom | Apdex by OS and app version |
builtin:apps.other.uaDuration.osAndVersion |
Microsecond | avg, count, max, median, min, percentile, sum | Mobile, custom | Duration of user actions |
builtin:apps.other.crashCount.osAndVersion |
Count | value | Mobile, custom | Detected crashes, by OS and version |
builtin:apps.other.crashFreeUsersRate.os |
Percent (%) | value | Mobile, custom | Estimated % of crash-free users |
builtin:synthetic.browser.availability.location.total |
Percent (%) | avg | Browser monitor | Availability rate, by location |
builtin:synthetic.browser.failure |
Count | value | Browser monitor | Failed executions |
builtin:synthetic.browser.totalDuration |
Millisecond | avg, count, max, median, min, percentile, sum | Browser monitor | Total duration of an execution’s actions |
builtin:synthetic.http.availability.location.total |
Percent (%) | avg | HTTP monitor | Availability rate, by location |
builtin:synthetic.http.duration.geo |
Millisecond | avg, count, max, min, sum | HTTP monitor | Summed duration of requests, by location |
builtin:synthetic.http.statusCode |
Count | value | HTTP monitor | Executions by HTTP status code |
How to read an entry
Each entry follows the same order: what the metric measures, a concrete use case, a pitfall, then a selector. Selectors split by dt.entity.application for web, dt.entity.synthetic_test for browser monitors and dt.entity.http_check for HTTP monitors, using only documented transformations (splitBy, sort, limit, aggregations, percentile). Thresholds mentioned are reference points to calibrate on your own history, not official values, unless stated otherwise.
Web applications: experience and performance
builtin:apps.web.apdex.userType
Apdex score from 0 to 1 computed on user actions, splittable by user type (real, synthetic, robot). It is the summary indicator of experience: it combines satisfied, tolerating and frustrated users according to the thresholds configured in the application. Use case: a “real users Apdex” SLO per application. Pitfall: without filtering on user type, robots and synthetic traffic mix with real traffic.
builtin:apps.web.apdex.userType:splitBy("dt.entity.application"):avg:sort(value(avg,ascending)):limit(10)builtin:apps.web.actionCount.load.browser
Number of page load actions, split by browser. It is traffic seen from the client, the counterpart of service throughput. Use case: a sudden drop while services respond normally often points to a CDN, DNS or RUM JavaScript injection problem. Pitfall: XHR and custom actions have their own keys; a single-page application generates few “load” actions.
builtin:apps.web.actionCount.load.browser:splitBy("dt.entity.application"):sumbuiltin:apps.web.actionDuration.load.browser
Duration of load actions, from click to end of loading. Use case: track the 90th percentile per application rather than the average, which hides the slow tail. Pitfall: this duration includes the client network and rendering; an increase does not necessarily come from the back end.
builtin:apps.web.actionDuration.load.browser:splitBy("dt.entity.application"):percentile(90)builtin:apps.web.actionDuration.xhr.browser
Duration of XHR actions, the asynchronous calls triggered by a click in an already loaded page. For a single-page application, it is often the main performance metric. Use case: correlate an increase with the response time of the called service (module 3). Pitfall: badly grouped background calls can inflate or distort the measurement.
builtin:apps.web.actionDuration.xhr.browser:splitBy("dt.entity.application"):percentile(90)builtin:apps.web.visuallyComplete.load.browser
Time needed for the viewport content to be fully rendered. A Dynatrace-specific metric, it matches the “page is ready” perception. Use case: compare before and after a front-end release. Pitfall: an endless carousel or animation can delay the value without bothering users.
builtin:apps.web.visuallyComplete.load.browser:splitBy("dt.entity.application"):medianbuiltin:apps.web.largestContentfulPaint.load.browser
Time to render the largest element in the viewport, one of the Core Web Vitals. Google rates an LCP of 2.5 s or less at the 75th percentile as “good”; that reference comes from web.dev, not from Dynatrace. Use case: track LCP on landing pages, which matter for search ranking. Pitfall: computed only for load actions and for browsers that expose the API.
builtin:apps.web.largestContentfulPaint.load.browser:splitBy("dt.entity.application"):percentile(75)builtin:apps.web.cumulativeLayoutShift.load.browser
Unitless score of unexpected shifts of visible elements during loading. Use case: detect a banner or ad inserted without reserved space, which makes users click the wrong thing. Pitfall: it is a score, not a duration; do not put it on the same axis as millisecond metrics.
builtin:apps.web.cumulativeLayoutShift.load.browser:splitBy("dt.entity.application"):percentile(75)builtin:apps.web.interactionToNextPaint
Interaction to Next Paint: delay between an interaction (click, typing) and the next paint. The responsiveness Core Web Vital that replaces First Input Delay. Use case: spot heavy JavaScript that freezes the interface. Pitfall: the documentation does not list the avg aggregation for this key; use median or percentile.
builtin:apps.web.interactionToNextPaint:splitBy("dt.entity.application"):percentile(75)builtin:apps.web.activeSessions
Estimated number of active sessions, those where the user is confirmed to still be present. The documentation states the estimate relies on the HyperLogLog algorithm. Use case: know how many users an incident affects right now, a figure expected in any incident communication. Pitfall: approximate value; do not reconcile it to the unit with a marketing tool.
builtin:apps.web.activeSessions:splitBy("dt.entity.application"):maxbuiltin:apps.web.bouncedSessionRatio
Percentage of sessions limited to a single page and a single web request. Use case: a sudden rise after a release can reveal a broken home page that technical metrics miss. Pitfall: bounce rate depends heavily on page type; an information page naturally has a high rate.
builtin:apps.web.bouncedSessionRatio:splitBy("dt.entity.application"):avgbuiltin:apps.web.countOfErrors
Number of detected errors, splittable by user type, error type and origin. Use case: separate JavaScript errors from request errors to know which team to call. Pitfall: a noisy third-party script (ads, chat) can dominate the counter; filter on origin before alerting.
builtin:apps.web.countOfErrors:splitBy("dt.entity.application"):sum:sort(value(sum,descending)):limit(10)builtin:apps.web.jsErrorsDuringUa
JavaScript errors that occurred during a user action. Its twin builtin:apps.web.jsErrorsWithoutUa counts those between two actions. Use case: errors during an action directly affect a click, so they are more urgent. Pitfall: a raw counter grows with traffic; relate it to the number of actions.
builtin:apps.web.jsErrorsDuringUa:splitBy("dt.entity.application"):sumbuiltin:apps.web.percentageOfUserActionsAffectedByErrors
Percentage of user actions with at least one detected error. Already normalised by traffic, it makes a good client-side error SLI. Use case: an SLO such as “fewer than X % of actions with errors”, X set from your history. Pitfall: an error with no visible impact counts as much as a blank page.
builtin:apps.web.percentageOfUserActionsAffectedByErrors:splitBy("dt.entity.application"):avgMobile and custom applications
builtin:apps.other.apdex.osAndVersion
Apdex of user actions in a mobile or custom application, by OS and app version. Use case: check that a new store release does not degrade experience before widening a staged rollout. Pitfall: old versions keep few users; their Apdex varies strongly on a small sample.
builtin:apps.other.apdex.osAndVersion:splitBy():avgbuiltin:apps.other.uaDuration.osAndVersion
Duration of mobile user actions, by OS and version. Use case: compare the 90th percentile between two app versions. Pitfall: the unit is the microsecond, not the millisecond as for web; check the axis before concluding there is a regression.
builtin:apps.other.uaDuration.osAndVersion:splitBy():percentile(90)builtin:apps.other.crashCount.osAndVersion
Number of detected crashes, by OS and version. Use case: a version that concentrates crashes right after release justifies freezing the rollout. Pitfall: an absolute counter follows the number of users; prefer the crash-free user rate for comparisons.
builtin:apps.other.crashCount.osAndVersion:splitBy():sumbuiltin:apps.other.crashFreeUsersRate.os
Estimated percentage of unique users not affected by a crash, by OS (HyperLogLog estimate according to the documentation). It is the most readable mobile stability SLI for a product team. Use case: track a stability objective per iOS and Android platform. Pitfall: estimated value, unreliable for an application with a very small audience.
builtin:apps.other.crashFreeUsersRate.os:splitBy():avgBrowser and HTTP synthetic monitors
builtin:synthetic.browser.availability.location.total
Availability rate of browser monitors, by location. Use case: availability SLI of a critical journey (login, checkout), measured even without real traffic. The …totalWoMaintenanceWindow variant excludes maintenance windows, useful for an SLA report. Pitfall: a single failing location lowers the average; look at the per-location split before escalating.
builtin:synthetic.browser.availability.location.total:splitBy("dt.entity.synthetic_test"):avgbuiltin:synthetic.browser.failure
Number of failed executions of a browser monitor. Divided by builtin:synthetic.browser.total, it gives a failure rate. Use case: alert on several consecutive failures rather than one, often caused by a network glitch at the location. Pitfall: a script broken by a UI change fails too; check the details before blaming production.
builtin:synthetic.browser.failure:splitBy("dt.entity.synthetic_test"):sumbuiltin:synthetic.browser.totalDuration
Duration of all actions in an execution, per monitor. Use case: a stable baseline, free of client network variability, to detect a performance regression at deployment. Pitfall: adding a step to the script lengthens the duration; annotate those changes on your charts.
builtin:synthetic.browser.totalDuration:splitBy("dt.entity.synthetic_test"):avgbuiltin:synthetic.http.availability.location.total
Availability rate of HTTP monitors, by location. Lighter than browser monitors, they watch APIs and health endpoints at high frequency. Use case: availability SLI of a public API. Pitfall: an HTTP monitor validates a response, not a page render; it does not replace a browser monitor for a journey.
builtin:synthetic.http.availability.location.total:splitBy("dt.entity.http_check"):avgbuiltin:synthetic.http.duration.geo
Summed duration of all requests in an HTTP monitor, by location. Neighbouring keys …dns.geo, …tcpConnectTime.geo, …tlsHandshakeTime.geo and …timeToFirstByte.geo break that time down. Use case: an increase limited to one location points to the network rather than the application. Pitfall: no median or percentile is documented for this key.
builtin:synthetic.http.duration.geo:splitBy("dt.entity.http_check"):maxbuiltin:synthetic.http.statusCode
Number of executions per HTTP status code, by location. Use case: tell a 503 (service unavailable) from a 401 (expired token in the monitor), two very different incidents. Pitfall: a 200 does not guarantee correct content; add a validation rule in the monitor.
builtin:synthetic.http.statusCode:splitBy("dt.entity.http_check"):sumHow to check that it works
- Open Data Explorer, switch to Code mode and paste a selector from an entry: a chart should appear within seconds.
- If the response is empty, read the descriptor:
GET /api/v2/metrics/builtin:apps.web.apdex.userTypewith a token carrying themetrics.readscope. It lists unit, aggregations and dimensions. - For web RUM, check that the application is detected and that the RUM JavaScript is injected into pages (browser network tab).
- For synthetic, check that the monitor is enabled and that a location (public or private, synthetic ActiveGate) is assigned to it.
curl -s -H "Authorization: Api-Token $DT_TOKEN" \
  "https://managed.example.com/e/ENV-ID/api/v2/metrics/query?metricSelector=builtin:synthetic.http.availability.location.total:avg&from=now-24h"
Good practices
- Combine RUM and synthetic: RUM tells you what users experience, synthetic tells you whether the service answers when nobody uses it.
- Percentiles rather than averages for durations: the average hides the slowest users.
- Filter out robots and synthetic traffic from real-experience SLOs using the user type.
Frequently asked questions
Why do mobile keys start with apps.other?
In Dynatrace Managed, mobile and custom applications share the builtin:apps.other.* family, labelled [mobile, custom] in the documentation. Only a few keys, such as builtin:apps.mobile.sessionCount, have a dedicated prefix.
Are Dynatrace Core Web Vitals the same as Google’s?
They measure the same phenomena (LCP, CLS, INP) for your real users, but on your population and your browsers. The figures can therefore differ from Google’s reports, which rely on another sample.
Do these keys work on Dynatrace SaaS?
In the SaaS classic interface, yes. On Grail, RUM and synthetic expose other keys queried with DQL; the SaaS metrics course covers them.
With these 23 entries, you have the user-side SLIs: experience, responsiveness, errors, mobile stability and synthetic availability. The next module goes back down to processes, runtimes and containers.
← Module 3: services · Course overview · Module 5: processes and containers →
span.observer is an independent community blog, not affiliated with Dynatrace LLC. This module is an annotated selection: the reference remains the official documentation for your Dynatrace Managed version, where every key, unit and aggregation should be checked.