Module 5 of the Dynatrace Managed metrics course: builtin process metrics, plus runtime (JVM, .NET, Node.js, Go), container and Kubernetes metrics, in 24 entries with the exact key, unit, use case and a ready-to-paste selector.
Learning path: Dynatrace Managed metrics training · Module 5/7 · Type: reference · Platform: Dynatrace Managed (classic metrics)
In this module:
- a summary table of the 24 keys, to keep at hand
- one entry per metric: what it measures, when to use it, the pitfall to avoid
- a metric selector per entry, testable in Data Explorer
When a host misbehaves, the next question is always the same: which process, which JVM, which container? The metrics in this module answer that question. They sit below the service and above the host, and they are what shortens diagnosis, and therefore MTTR, when an infrastructure alert fires at night.
Everything below applies to Dynatrace Managed: builtin: keys, metric selector, Metrics API v2 and Data Explorer. There is no Grail or DQL here. On Dynatrace SaaS, the same measurements use dt.process.*, dt.runtime.* or dt.kubernetes.* keys; they are covered in the SaaS metrics course.
This module links module 2 on hosts and module 3 on services. Here, you go straight to the entry.
Builtin process metrics in one table
Every key, unit and aggregation below comes from the official list of Dynatrace Managed built-in metrics. The “Scope” column follows the documentation section; exact dimensions are listed in each metric’s descriptor.
| Key | Unit | Aggregations | Scope | What it measures |
|---|---|---|---|---|
builtin:tech.generic.cpu.usage |
Percent (%) | avg, max, min | Process | Process CPU, as a % of host CPU |
builtin:tech.generic.mem.workingSetSize |
Byte | avg, max, min | Process | Memory used by the process |
builtin:tech.generic.mem.exhaustedMem |
Count | value | Process | “Memory resource exhausted” events |
builtin:tech.generic.handles.fileDescriptorsPercentUsed |
Percent (%) | avg, max, min | Process (Linux) | % of the file descriptor limit |
builtin:tech.generic.network.packets.retransmission |
Percent (%) | avg, max, min | Process (network) | % of retransmitted packets |
builtin:tech.generic.network.sessions.reset |
Per second | avg, max, min | Process (network) | Incoming TCP sessions reset |
builtin:tech.generic.processCount |
Count | avg, max, min | Process | Number of worker processes |
builtin:pgi.availability.state |
Count | value | Process instance | Process availability state, per minute |
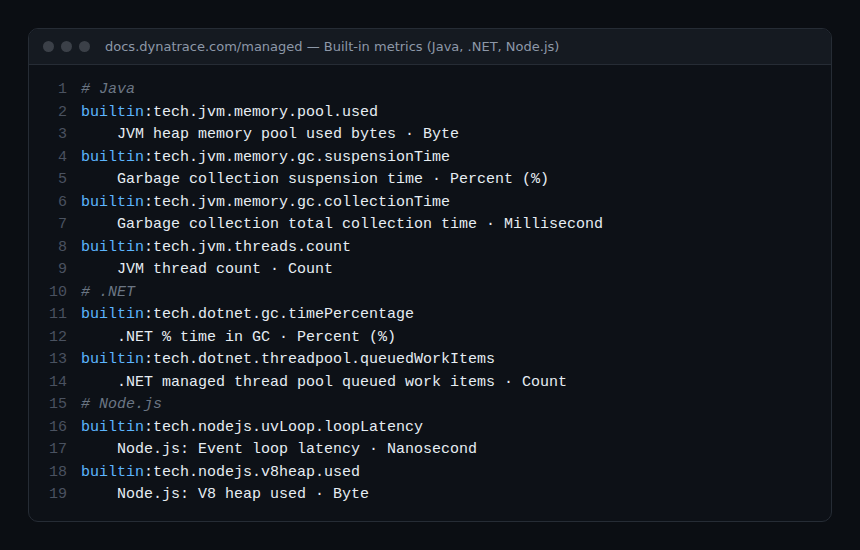
builtin:tech.jvm.memory.pool.used |
Byte | avg, max, min | JVM | Memory used per heap pool |
builtin:tech.jvm.memory.gc.suspensionTime |
Percent (%) | avg, max, min | JVM | Share of time spent in GC pauses |
builtin:tech.jvm.memory.gc.collectionTime |
Millisecond | value | JVM | Accumulated collection time, all pools |
builtin:tech.jvm.threads.count |
Count | avg, max, min | JVM | Live JVM threads |
builtin:tech.dotnet.gc.timePercentage |
Percent (%) | avg, max, min | .NET | % of time spent in .NET GC |
builtin:tech.dotnet.threadpool.queuedWorkItems |
Count | avg, max, min | .NET | Work items queued in the thread pool |
builtin:tech.nodejs.uvLoop.loopLatency |
Nanosecond | avg, max, min | Node.js | Event loop latency |
builtin:tech.nodejs.v8heap.used |
Byte | avg, max, min | Node.js | V8 heap used by application data |
builtin:tech.go.memory.heap.live |
Byte | avg, max, min | Go | Go heap considered live by the GC |
builtin:containers.cpu.throttledMilliCores |
Millicores | avg, max, min | Container | Container CPU throttling |
builtin:containers.memory.limitPercent |
Percent (%) | avg | Container | Memory limit, as a % of physical memory |
builtin:containers.memory.outOfMemoryKills |
Count | value | Container | Out of memory kills |
builtin:kubernetes.container.restarts |
Count | value | Kubernetes (container) | Container restarts |
builtin:kubernetes.node.requests_cpu |
Millicores | avg, max, min | Kubernetes (node) | Pod CPU requests, by node |
builtin:kubernetes.workload.pods_desired |
Count | avg, max, min | Kubernetes (workload) | Desired pods per workload |
builtin:kubernetes.persistentvolumeclaim.used |
Byte | avg, max, min | Kubernetes (PVC) | Bytes used in the volume |
How to read an entry
Each entry follows the same order: what the metric measures, a concrete use case, a pitfall, then a selector. Selectors split by dt.entity.process_group_instance when the metric is about a process, and only use documented transformations (splitBy, sort, limit, aggregations). Thresholds mentioned are markers to calibrate on your own history, not official values.
Processes: CPU, memory, network and availability
builtin:tech.generic.cpu.usage
Sum of CPU time used by every worker of the process, divided by the host’s available CPU: 100% means the process uses the whole host. Open it first when builtin:host.cpu.usage climbs: it tells you which process is responsible. Use case: rank the ten hungriest processes on a saturated host. Pitfall: on a 16-core host, a single-threaded process tops out around 6%; a low figure does not prove there is no bottleneck.
builtin:tech.generic.cpu.usage:splitBy("dt.entity.process_group_instance"):sort(value(avg,descending)):limit(10)builtin:tech.generic.mem.workingSetSize
Sum of the memory used by every worker, shared memory included. The documentation presents it as the tool for spotting heavy consumers and leaks. Use case: a sawtooth curve whose floor keeps rising between restarts points to a likely leak. Pitfall: shared memory is counted, so adding up several processes on one host overstates the total.
builtin:tech.generic.mem.workingSetSize:splitBy("dt.entity.process_group_instance"):sort(value(max,descending)):limit(10)builtin:tech.generic.mem.exhaustedMem
Number of “Memory resource exhausted” events generated by the workers in one minute; the JVM raises them when it runs out of memory. Use case: any non-zero value on a production JVM deserves a look, often before the OutOfMemoryError shows up in the logs. Pitfall: no data point does not mean zero; check that the process is a JVM under deep monitoring.
builtin:tech.generic.mem.exhaustedMem:splitBy("dt.entity.process_group_instance")builtin:tech.generic.handles.fileDescriptorsPercentUsed
Highest percentage of the file descriptor limit used among the workers, on Linux. Use case: a server that opens connections without closing them creeps towards 100%, then fails with “Too many open files”. An alert well before the limit leaves time to act. Pitfall: the metric does not exist on Windows.
builtin:tech.generic.handles.fileDescriptorsPercentUsed:splitBy("dt.entity.process_group_instance"):maxbuiltin:tech.generic.network.packets.retransmission
Percentage of TCP packets retransmitted for the process, measured by OneAgent network analysis. Use case: a slow service with no visible application cause; rising retransmissions point to the network (loss, saturation, MTU) rather than the code. Pitfall: with few packets, a handful of retransmissions gives a dramatic percentage; read it next to traffic.
builtin:tech.generic.network.packets.retransmission:splitBy("dt.entity.process_group_instance"):maxbuiltin:tech.generic.network.sessions.reset
Number per second of incoming TCP sessions ended by a reset error (RST). Use case: after a load balancer or firewall change, a sudden rise reveals connections cut mid-way. Pitfall: some clients close with RST on purpose; compare with a reference period rather than with zero.
builtin:tech.generic.network.sessions.reset:splitBy("dt.entity.process_group_instance"):avgbuiltin:tech.generic.processCount
Number of workers of a process (Apache, PHP-FPM, IIS…). The documentation notes that too few workers degrade performance and too many waste resources. Use case: check that the pool really scales up during a peak. Pitfall: do not confuse it with builtin:tech.generic.count, which counts the processes in a group.
builtin:tech.generic.processCount:splitBy("dt.entity.process_group_instance"):maxbuiltin:pgi.availability.state
Availability state of the process instance, reported every minute. Use case: build an availability SLO for a component that does not depend on traffic, or spot night-time restarts. Pitfall: it is a state, not a percentage; read the descriptor to find the state dimension before filtering.
builtin:pgi.availability.state:splitBy("dt.entity.process_group_instance")Technologies: JVM, .NET, Node.js and Go
builtin:tech.jvm.memory.pool.used
Memory currently occupied in each JVM pool (Eden, Survivor, Old Gen depending on the collector). Use case: an Old Gen whose floor rises after each major collection is the classic sign of a leak. Pitfall: Eden naturally swings between empty and full; summing all pools hides the one curve that matters.
builtin:tech.jvm.memory.pool.used:splitBy("dt.entity.process_group_instance"):maxbuiltin:tech.jvm.memory.gc.suspensionTime
Time spent between the start and the end of garbage collector pauses, as a percentage. This metric links GC to what users feel: during a pause, the application does not respond. Use case: correlate response time spikes with suspension spikes. Pitfall: an hourly average smooths out long pauses; use max.
builtin:tech.jvm.memory.gc.suspensionTime:splitBy("dt.entity.process_group_instance"):maxbuiltin:tech.jvm.memory.gc.collectionTime
Approximate time spent collecting, across all pools. Use case: compare two application versions or two collector settings under the same load. Pitfall: the SaaS documentation notes that this key diverges from its Grail equivalent for Go processes; on Managed, stick to the builtin: key and its descriptor.
builtin:tech.jvm.memory.gc.collectionTime:splitBy("dt.entity.process_group_instance")builtin:tech.jvm.threads.count
Number of live threads, daemons included. Use case: steady growth reveals an unbounded pool or threads never released, before the JVM runs out of native memory. Pitfall: a high but stable count is normal on an application server; the trend is what matters.
builtin:tech.jvm.threads.count:splitBy("dt.entity.process_group_instance"):maxbuiltin:tech.dotnet.gc.timePercentage
Percentage of time spent in the CLR garbage collector. Use case: an ASP.NET application slowing down under load while host CPU stays reasonable; a high GC % points to allocations (strings, large objects) rather than the database. Pitfall: read it alongside large object heap (LOH) consumption, often the culprit.
builtin:tech.dotnet.gc.timePercentage:splitBy("dt.entity.process_group_instance"):maxbuiltin:tech.dotnet.threadpool.queuedWorkItems
Number of work items queued in the managed thread pool. Use case: a growing queue while response times explode is the signature of thread pool starvation, often caused by blocking calls in async code. Pitfall: a brief queue during a peak is normal; alert on a queue that lasts.
builtin:tech.dotnet.threadpool.queuedWorkItems:splitBy("dt.entity.process_group_instance"):maxbuiltin:tech.nodejs.uvLoop.loopLatency
Average latency between when an event is expected and when it is processed. Node.js being single-threaded, a blocked loop delays every request. Use case: spot an expensive synchronous task (large JSON, encryption) introduced by a new release. Pitfall: the unit is the nanosecond; convert before comparing with response times in milliseconds.
builtin:tech.nodejs.uvLoop.loopLatency:splitBy("dt.entity.process_group_instance"):maxbuiltin:tech.nodejs.v8heap.used
Size of the V8 heap used by application data, measured by periodic snapshot. Use case: a steady rise up to the heap ceiling precedes “heap out of memory” crashes. Pitfall: compare it with builtin:tech.nodejs.v8heap.total; only the headroom between the two tells you the risk.
builtin:tech.nodejs.v8heap.used:splitBy("dt.entity.process_group_instance"):maxbuiltin:tech.go.memory.heap.live
Memory the Go garbage collector considers live: what the last collection retained, plus what has been allocated since. Use case: track the real footprint of a Go service after an upgrade. Pitfall: process memory as seen by the OS stays higher, since the runtime keeps idle pages.
builtin:tech.go.memory.heap.live:splitBy("dt.entity.process_group_instance"):maxContainers and Kubernetes
builtin:containers.cpu.throttledMilliCores
CPU denied to the container by its limit, in millicores. Use case: a slow container while the host has free CPU; non-zero throttling shows the limit, not the machine, is the bottleneck. Pitfall: without a CPU limit, there is no throttling to measure.
builtin:containers.cpu.throttledMilliCores:sort(value(max,descending)):limit(10)builtin:containers.memory.limitPercent
Container memory limit relative to the host’s physical memory; empty when no limit is set. Use case: list containers without a limit, the ones that can starve their neighbours. Pitfall: a missing value is information here, not a collection gap.
builtin:containers.memory.limitPercent:sort(value(avg,descending))builtin:containers.memory.outOfMemoryKills
Number of times the kernel killed the container for exceeding its memory. Use case: explain restarts that leave no trace in application logs; treat any non-zero value as an incident. Pitfall: on Kubernetes, cross-check with builtin:kubernetes.container.oom_kills, which carries the workload context.
builtin:containers.memory.outOfMemoryKillsbuiltin:kubernetes.container.restarts
Delta of the restartCount counter in the container status; written only when at least one restart occurred. Use case: catch a CrashLoopBackOff before a user complains. Pitfall: no data is the normal case, not a collection failure.
builtin:kubernetes.container.restartsbuiltin:kubernetes.node.requests_cpu
Sum of the CPU requests of the pods’ app containers, aggregated by node. Use case: compared with builtin:kubernetes.node.cpu_allocatable, it tells you how much room the scheduler has left, regardless of actual usage. Pitfall: a node “full” on requests can be almost idle; it is a sizing issue, not a load issue.
builtin:kubernetes.node.requests_cpu:sort(value(max,descending))builtin:kubernetes.workload.pods_desired
Number of expected pods: the replicas field of a deployment, or desiredNumberScheduled for a daemon set. Use case: compared with running pods, it reveals a stuck rollout or an autoscaler at its ceiling. Pitfall: it is an intent, not a state; it does not drop when pods fail.
builtin:kubernetes.workload.pods_desired:maxbuiltin:kubernetes.persistentvolumeclaim.used
Bytes used in the volume of a persistent volume claim. Use case: relative to builtin:kubernetes.persistentvolumeclaim.capacity, it anticipates a full volume for a database or a broker. Pitfall: a full volume does not always crash the pod; the application may simply stop writing.
builtin:kubernetes.persistentvolumeclaim.used:sort(value(max,descending)):limit(10)How to check it works
- Open Data Explorer, switch to Code mode and paste a selector from an entry: a chart should appear within seconds.
- If the result is empty, read the descriptor:
GET /api/v2/metrics/builtin:tech.jvm.threads.countwith a token holding themetrics.readscope. It lists unit, aggregations and dimensions. - For runtime metrics, check on the process page that deep monitoring is active and that the process was restarted after OneAgent was installed.
- For Kubernetes, confirm the cluster is monitored by the Dynatrace Operator; without it,
builtin:kubernetes.*keys stay empty.
curl -s -H "Authorization: Api-Token $DT_TOKEN" \
  "https://managed.example.com/e/ENV-ID/api/v2/metrics/query?metricSelector=builtin:tech.jvm.threads.count:max&from=now-2h"
Good practices
- Start from the symptom: high host CPU →
builtin:tech.generic.cpu.usage; slow JVM → GC suspension; restarts → OOM kills and restarts. - Alert on duration rather than on a spike: GC, the .NET queue and under-replicated partitions all have normal peaks.
- Keep selectors in the repository of your dashboards, as described in the article on Managed dashboard JSON tiles.
Frequently asked questions
Why does a JVM metric stay empty for my Java process?
builtin:tech.jvm.* keys require deep monitoring of the process. A process started before OneAgent, or excluded by a rule, only reports the generic builtin:tech.generic.* metrics.
What is the difference between builtin:containers.* and builtin:kubernetes.*?
The former come from OneAgent on the host and describe the container (CPU, memory, throttling). The latter come from Kubernetes monitoring and describe cluster objects (nodes, workloads, quotas, volumes). To diagnose a pod, you combine both, as in the CrashLoopBackOff and OOMKilled diagnosis.
Do these keys work on Dynatrace SaaS?
In the SaaS classic interface, yes. On Grail, the equivalents use dt.* keys and are queried with DQL, sometimes with calculation differences flagged by the migration documentation.
With these 24 entries, you can go from host to process, runtime and container without hunting for the key. The next module covers cloud, virtualisation and extensions.
← Module 4: applications and synthetic · Course overview · Module 6: cloud and extensions →
span.observer is an independent community blog, not affiliated with Dynatrace LLC. This module is an annotated selection: the reference remains the official documentation for your Dynatrace Managed version, where every key, unit and aggregation should be checked.