
Module 2 of the Dynatrace Managed metrics course, a builtin host metrics reference for Dynatrace Managed: 20 builtin:host.* metrics selected for day-to-day operations, each with its exact key, unit, aggregations and a ready-to-copy metric selector query.
Learning path: Dynatrace Managed metrics training · Module 2/7 · Domain: hosts and infrastructure · Platform: Dynatrace Managed (Metrics API v2, metric selector)
A saturated host takes down everything it runs: processes, services and, in the end, the user experience. Host metrics are therefore the first layer of any diagnosis. The Dynatrace Managed builtin list holds hundreds of them; about twenty are enough to cover CPU, memory, disk, network and availability.
This module applies the reading grid from module 1 (Dynatrace metrics explained) to hosts. Each entry gives the key, what it measures, one use case and one pitfall; keep it at hand during a diagnosis.
Everything below applies to Dynatrace Managed and to classic metrics in Dynatrace SaaS. On Grail, the equivalents use dt.host.* keys and are queried with DQL: that is the subject of the SaaS metrics course.
Builtin host metrics: the summary table
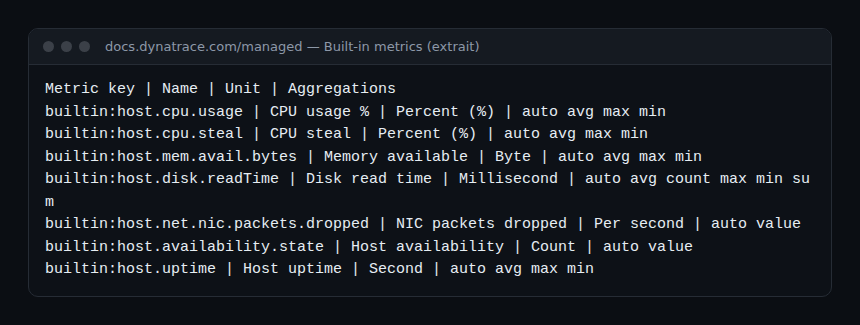
Keys, units and aggregations come from the Built-in metrics page of the Managed documentation. All of them carry the dt.entity.host dimension; disk metrics add dt.entity.disk, and network interface metrics add an interface dimension.
| Key | Unit | Aggregations | What it measures |
|---|---|---|---|
builtin:host.cpu.usage |
% | avg, max, min | CPU in use |
builtin:host.cpu.user |
% | avg, max, min | CPU in user mode |
builtin:host.cpu.system |
% | avg, max, min | CPU in kernel mode |
builtin:host.cpu.iowait |
% | avg, max, min | Waiting for I/O |
builtin:host.cpu.steal |
% | avg, max, min | CPU taken by the hypervisor |
builtin:host.cpu.load |
Ratio | avg, max, min | System load over 1 minute |
builtin:host.mem.usage |
% | avg, max, min | Memory used |
builtin:host.mem.avail.bytes |
Byte | avg, max, min | Memory available |
builtin:host.mem.swap.used |
Byte | avg, max, min | Swap used |
builtin:host.mem.avail.pfps |
Per second | avg, max, min | Page faults |
builtin:host.disk.usedPct |
% | avg, max, min | Disk space used |
builtin:host.disk.avail |
Byte | avg, max, min | Disk space available |
builtin:host.disk.inodesAvail |
% | avg, max, min | Free inodes |
builtin:host.disk.queueLength |
Count | avg, max, min | Disk queue |
builtin:host.disk.readTime |
Millisecond | avg, count, max, min, sum | Read latency |
builtin:host.disk.writeTime |
Millisecond | avg, count, max, min, sum | Write latency |
builtin:host.net.nic.trafficIn |
bit/s | avg, max, min | Inbound traffic |
builtin:host.net.nic.packets.dropped |
Per second | value | Dropped packets |
builtin:host.availability.state |
Count | value | Availability state |
builtin:host.uptime |
Second | avg, max, min | Time since boot |
CPU
builtin:host.cpu.usage
The percentage of CPU time in use, across all cores. It is the most watched saturation metric. Use max rather than the default average to see peaks: an interval average easily hides a short saturation. Always cross-check with cpu.load before drawing conclusions.
builtin:host.cpu.usage:splitBy("dt.entity.host"):max:sort(value(max,descending)):limit(10)builtin:host.cpu.user
The share of CPU spent in user mode, in other words in application code. If cpu.usage rises and cpu.user carries most of it, look at the application processes (module 5 of the course).
builtin:host.cpu.user:splitBy("dt.entity.host"):avgbuiltin:host.cpu.system
The share spent in kernel mode. A high, sustained value suggests many system calls, context switches or network interrupts. Compare it with the host’s own history rather than with an absolute threshold.
builtin:host.cpu.system:splitBy("dt.entity.host"):maxbuiltin:host.cpu.iowait
The time the CPU was idle while an I/O request was outstanding. The documentation states that it is not available on Windows. Rising iowait together with disk latency points at storage, not at the CPU.
builtin:host.cpu.iowait:splitBy("dt.entity.host"):maxbuiltin:host.cpu.steal
The time a virtual machine waits for cycles the hypervisor gives to other VMs; the documentation lists it for Linux hosts. A slow application on a host with moderate CPU but high steal is a matter for the virtualisation team, not the application team.
builtin:host.cpu.steal:splitBy("dt.entity.host"):avg:sort(value(avg,descending))builtin:host.cpu.load
The average number of processes running or waiting for the CPU over the last minute (load5m and load15m also exist). The unit is a ratio: compare it with the host’s core count. A load above the number of cores means a queue.
builtin:host.cpu.load:splitBy("dt.entity.host"):maxMemory
builtin:host.mem.usage
The percentage of memory used, computed by OneAgent as total minus available. Known pitfall: the value does not match the “used” figure of free or Task Manager, because reclaimable cache counts as available. Do not compare the two numbers in the middle of an incident.
builtin:host.mem.usage:splitBy("dt.entity.host"):maxbuiltin:host.mem.avail.bytes
Available memory in bytes, estimated without swapping. It is often a better alerting signal than the percentage: on a large server, 5 % free still means several gigabytes.
builtin:host.mem.avail.bytes:splitBy("dt.entity.host"):min:sort(value(min,ascending)):limit(10)builtin:host.mem.swap.used
Swap space used, in bytes. Stable swap is not a worry; swap that grows while available memory falls signals memory pressure and slower response times.
builtin:host.mem.swap.used:splitBy("dt.entity.host"):maxbuiltin:host.mem.avail.pfps
Page faults per second, soft and hard faults combined according to the documentation. On its own the value is hard to read; a clear break from the previous week, combined with swap, confirms a memory shortage.
builtin:host.mem.avail.pfps:splitBy("dt.entity.host"):avgDisk
builtin:host.disk.usedPct
The percentage of space used per file system. This is the metric behind “disk full” alerts. Watch the trend: a partition at 80 % gaining 2 points a day is more urgent than one stable at 90 %.
builtin:host.disk.usedPct:splitBy("dt.entity.host","dt.entity.disk"):max:sort(value(max,descending)):limit(20)builtin:host.disk.avail
Free space in bytes. On Linux and AIX, the documentation specifies that this is the space available to an unprivileged user, excluding the root reserve, so it can be lower than what df shows as root.
builtin:host.disk.avail:splitBy("dt.entity.host","dt.entity.disk"):minbuiltin:host.disk.inodesAvail
The percentage of free inodes, not available on Windows. A disk can refuse every write while space remains: the classic case is a directory full of small files (sessions, queues, rotated logs).
builtin:host.disk.inodesAvail:splitBy("dt.entity.host","dt.entity.disk"):minbuiltin:host.disk.queueLength
The average number of read and write operations in the disk queue. A queue that stays high means the disk no longer keeps up; read it together with the read and write times below.
builtin:host.disk.queueLength:splitBy("dt.entity.host","dt.entity.disk"):maxbuiltin:host.disk.readTime
The average time of a file system read, in milliseconds: disk latency as the host sees it. It often explains a slow database while the CPU stays flat.
builtin:host.disk.readTime:splitBy("dt.entity.host","dt.entity.disk"):avgbuiltin:host.disk.writeTime
The write counterpart, in milliseconds. Transaction logs and message queues are very sensitive to it. Compare values before and after a storage migration to measure the change objectively.
builtin:host.disk.writeTime:splitBy("dt.entity.host","dt.entity.disk"):maxNetwork, availability and OS
builtin:host.net.nic.trafficIn
Inbound traffic per interface, in bits per second; builtin:host.net.nic.trafficOut gives outbound traffic. Mind the unit: divide by 8 to compare with a throughput in bytes. Relate the value to the interface capacity.
builtin:host.net.nic.trafficIn:splitBy("dt.entity.host"):max:sort(value(max,descending)):limit(10)builtin:host.net.nic.packets.dropped
Dropped packets per second on the interfaces; the droppedRx and droppedTx variants separate receive and transmit. Any value that stays above zero deserves a look, especially if service retransmissions increase.
builtin:host.net.nic.packets.dropped:splitBy("dt.entity.host")builtin:host.availability.state
The host availability state, reported every minute. Use it to measure infrastructure availability or to check that a host did not disappear during a given window. Before filtering on a state, read the exact dimensions in your environment’s descriptor.
builtin:host.availability.state:splitBy("dt.entity.host")builtin:host.uptime
Time since the last boot, in seconds. The documentation says it requires OneAgent 1.259 or later and is not available for application-only deployments. Handy for spotting an unplanned reboot just before an incident.
builtin:host.uptime:splitBy("dt.entity.host"):min:sort(value(min,ascending)):limit(10)How to check that it works
- List the keys actually present in your environment:
curl -s "$DT_URL/api/v2/metrics?metricSelector=builtin:host.*&fields=unit,aggregationTypes" \ -H "Authorization: Api-Token $DT_TOKEN" - Read a key’s descriptor (
GET /api/v2/metrics/builtin:host.disk.avail): unit, aggregations and dimensions should match the table. - Paste a query from this module into Data Explorer in code mode. A syntax error shows immediately; an empty series means an unmonitored host or a metric not available on that OS.
The token needs the metrics.read scope. The full metric selector syntax is covered in the metric selector and API module.
Best practices
- Always state the aggregation: without it, the default average smooths out peaks.
- Alert on available bytes rather than a percentage for large volumes.
- Read CPU, iowait and disk latency together before naming a culprit.
- Keep thresholds specific to your estate: the documentation sets no “normal” value.
Frequently asked questions
Why not list every builtin:host.* metric?
The official list holds several dozen, including very specific z/OS and AIX metrics. This module keeps those used in most diagnoses; the Built-in metrics page remains the exhaustive reference.
Do I need to learn all twenty keys by heart?
No. Remember the logic (CPU, memory, disk, network, availability) and come back to the summary table when you build a dashboard or an alert.
Do these keys work on Dynatrace SaaS?
Yes, as classic metrics through API v2. On Grail, use the dt.host.* keys and the DQL timeseries command, described in the SaaS metrics course.
These twenty entries cover the foundation of a host diagnosis. The next module moves one layer up: services, their requests and their errors. For more on infrastructure, see also the Dynatrace Managed architecture.
← Module 1: metrics explained · Course overview · Module 3: services →
span.observer is an independent community blog, not affiliated with Dynatrace LLC. The keys and units quoted come from the official Dynatrace Managed documentation; check them against your cluster version.