
Module 1 of the Dynatrace Managed metrics training: Dynatrace metrics explained before you query them, meaning how to read a key, its dimensions, its unit, its aggregations and its lifetime.
Learning path: Dynatrace Managed metrics training · Module 1/7 · Duration: ~35 min · Level: Beginner to intermediate
Objectives:
- Read a metric key and recognise its prefix (builtin:, ext:, calc:)
- Tell apart a metric’s dimensions, unit and aggregations
- Distinguish gauge and count data
- Know which resolution and retention apply to time series
Prerequisites: read access to a Managed environment and an API token with the metrics.read scope for the exercise.
A CPU chart shows 40% while the systems team sees 90% on the machine: this kind of gap wastes an hour in the middle of an incident. It almost always comes from a misread metric, an average taken for a maximum or a series merged across several hosts. To understand Dynatrace Managed metrics, you need to know what a key contains and how Dynatrace aggregates its data points.
This module lays those foundations. It applies to Dynatrace Managed and to the so-called “classic” metrics of Dynatrace SaaS; metrics stored in Grail (dt.* keys, DQL timeseries command) are covered in the Dynatrace SaaS Metrics learning path.
Dynatrace metrics explained: anatomy of a key
Each metric has a unique key, in lower case, with dots for the hierarchy. The prefix tells you where it comes from:
| Prefix | Origin | Example |
|---|---|---|
builtin: |
Metrics provided by OneAgent and the platform | builtin:host.cpu.usage |
ext: |
OneAgent or ActiveGate extensions (and classic AWS integration metrics) | depends on the extension |
calc: |
Calculated metrics you create | module 7 |
uscm. / uacm. |
USQL custom metrics (user sessions, user actions) | depends on your definition |
| no fixed prefix | Ingested metrics (ingestion protocol) | cpu.temperature |
Read the key from left to right: builtin:host.disk.avail reads “built-in metric, host family, disk sub-family, available space”. The full list is on the Built-in metrics page of the Managed documentation; the GET /api/v2/metrics call returns those actually present in your environment.
The descriptor: dimensions, unit, aggregations
Each key has a descriptor, returned by Metrics API v2. Here is the example the documentation gives for available disk space:
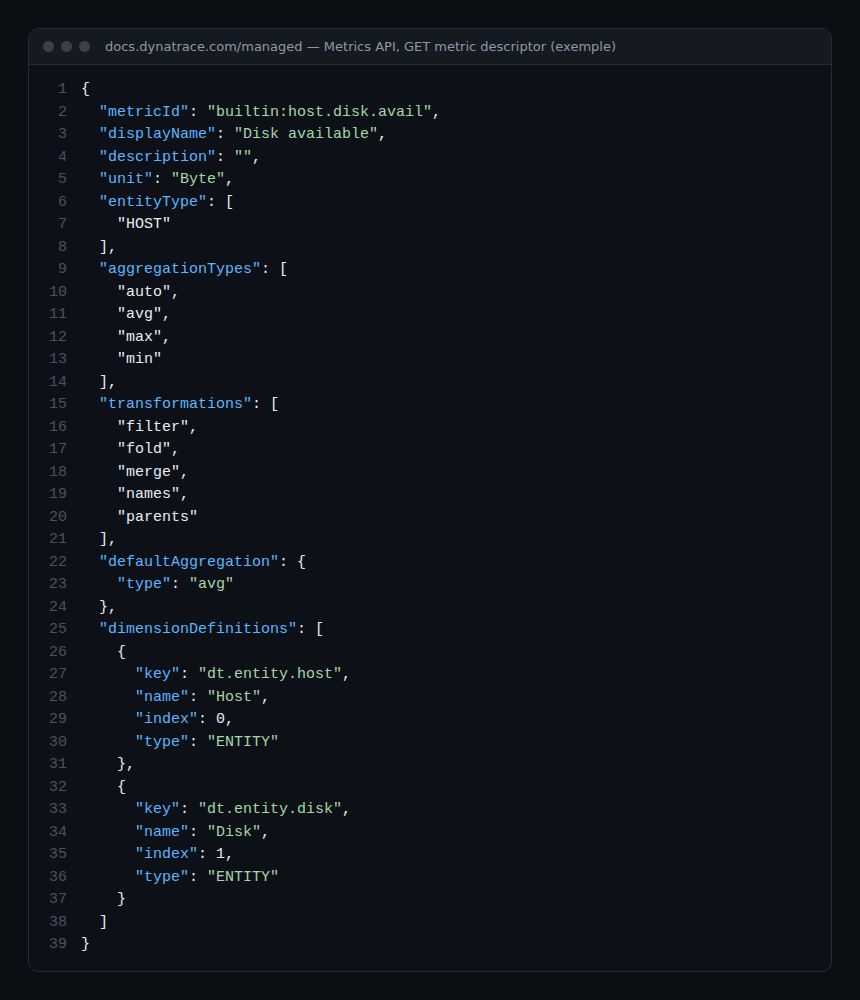
Four fields deserve your attention:
unit: bytes here. Service response times are in microseconds, which often surprises people the first time.dimensionDefinitions: how the metric is split. One series exists per combination of values, here per host and per disk. The first dimension is an entity, which lets you scope the query with anentitySelector.aggregationTypes: the allowed aggregations (auto,avg,max,min, and depending on the metriccount,sum,median,percentile,value).defaultAggregation: what you get when you specify nothing, here the average.
That last point explains the gap from the introduction: without an explicit aggregation, Dynatrace applies the default one. A one-minute average smooths out the peaks a max would have shown.
Gauge or count: two kinds of data
The ingestion protocol distinguishes two data point formats:
- gauge: a measurement at a point in time (temperature, CPU percentage, memory used). A gauge point can carry a
min,max,sum,countsummary. - count: a counter sent as a delta (
count,delta=500). With classic metrics, Dynatrace then suffixes the key with.count.
In built-in metrics, the same logic shows in the aggregations: builtin:service.requestCount.total only accepts auto and value, it is a count; builtin:host.cpu.usage accepts avg, max and min, it is a gauge.
Resolution, rollups and retention in Managed
Infrastructure metrics are captured every 10 seconds and stored as one-minute aggregates (min, max, count, sum, average). The available detail then depends on the age of the data: Dynatrace Managed keeps metrics for 5 years, but groups them into wider and wider intervals.
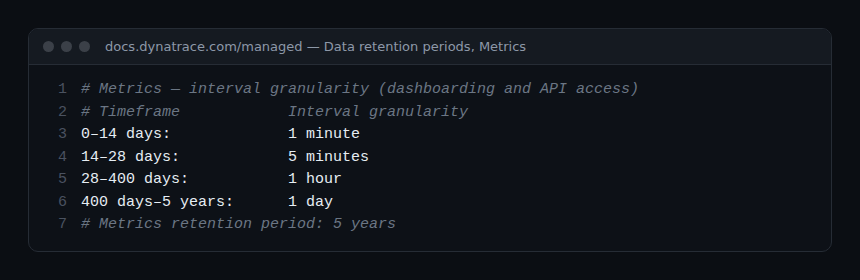
In practice: a two-minute spike from two months ago is no longer visible, it is diluted in an hourly average. If a post-incident review needs minute-level data, do it within 14 days. In a Managed cluster these series are stored in the metrics repository (Cassandra) and replicated across three nodes; the article on Dynatrace Managed architecture details this storage.
At query time, the API’s resolution parameter sets the step: 120 points over the timeframe by default, or an explicit step such as resolution=10m. The finest resolution is one minute.
Hands-on exercise
Do it on a Managed staging or demo environment.
Step 1 — List the host metrics of your environment
export DT_URL="https://{your-domain}/e/{your-environment-id}"
curl -s "$DT_URL/api/v2/metrics?metricSelector=builtin:host.*&fields=displayName,unit,aggregationTypes" \
  -H "Authorization: Api-Token $DT_TOKEN"
Expected result: a list of builtin:host.* keys with their name and unit.
Step 2 — Read a descriptor
curl -s "$DT_URL/api/v2/metrics/builtin:host.cpu.usage" \
  -H "Authorization: Api-Token $DT_TOKEN"
Expected result: the Percent unit, the avg default aggregation and the dt.entity.host dimension.
Step 3 — Compare average and maximum
Query the same metric with builtin:host.cpu.usage:avg then builtin:host.cpu.usage:max over two hours. Expected result: maximum values clearly higher than averages on a busy host.
Step 4 — Observe the effect of age
In Data Explorer, chart the same metric over 7 days then over 60 days. Expected result: data points further apart over the long timeframe, in line with the retention table.
Quiz
- Which prefix does a calculated metric carry? a)
builtin:b)ext:c)calc:d)dt. - What does a query without an explicit aggregation return? a) The maximum b) The descriptor’s default aggregation c) All aggregations d) An error
- Which granularity remains available for a 3-month-old metric? a) 1 minute b) 5 minutes c) 1 hour d) 1 day
- How is a count data point sent? a) As a delta b) As min/max c) As a percentage d) As a log
Answers
- c) Calculated metrics you create carry the
calc:prefix. - b) The descriptor’s
defaultAggregationfield applies. - c) Between 28 and 400 days, granularity is one hour.
- a) The count format carries the difference from the previous point.
Further reading
- Managed training, module 4: exploring data
- Dynatrace Managed API: endpoints and schemas
- Managed dashboards: tiles and JSON
- Metrics API v2 — GET metric descriptor
Course overview · Module 2: host and infrastructure metrics →
Frequently asked questions
Why doesn’t my Dynatrace chart match top or Task Manager?
The system tool shows an instant value; Dynatrace shows an average per interval by default, and the interval grows with the timeframe displayed. Ask for max and shorten the timeframe to get closer to the instant value.
Can one-minute granularity be kept beyond 14 days?
The Managed documentation presents these tiers as fixed for dashboards and the API. To keep a fine history, export the series you need through the API while they are still at minute level.
Do builtin: keys also exist in SaaS?
Yes, as classic metrics. With Grail, most have a dt.* equivalent queried in DQL; the SaaS learning path covers this mapping.
You can now read a key, its descriptor and its granularity. The next module applies this grid to host metrics: CPU, memory, disk, network and availability.
span.observer is an independent community blog, not affiliated with Dynatrace LLC. This learning path does not replace the official Dynatrace University training and certifications. Check features in the official documentation for your version.