Module 6 of the Dynatrace Managed metrics course: Dynatrace Managed cloud metrics, from vSphere to AWS, Azure, OpenStack and Cloud Foundry, then the metrics provided by extensions and technology integrations, in 22 entries.
Learning path: Dynatrace Managed metrics training · Module 6/7 · Type: reference · Platform: Dynatrace Managed (classic metrics)
In this module:
- a summary table of the 22 keys
- one entry per metric, with use case and pitfall
- collection prerequisites: vCenter, AWS and Azure integrations, extensions
A slow VM does not always have a problem inside the VM. CPU ready, hypervisor swap or shared datastore latency are invisible from the guest OS. These metrics give the view from the layer below, the one that explains incidents where “nothing changed” on the application side.
The content applies to Dynatrace Managed and classic builtin: metrics. These metrics only appear once the matching integration is configured: vCenter connection, AWS account or Azure subscription, enabled extension. On Dynatrace SaaS with Grail, some exist as dt.cloud.* keys; others, such as ESXi host availability, are not carried over.
For CloudWatch ingestion, see also the AWS CloudWatch article; to write your own extension, the PostgreSQL example.
Dynatrace Managed cloud metrics in one table
Keys, units and aggregations taken from the official list of built-in metrics. Scope follows the documentation section; exact dimensions are in the descriptor.
| Key | Unit | Aggregations | Scope | What it measures |
|---|---|---|---|---|
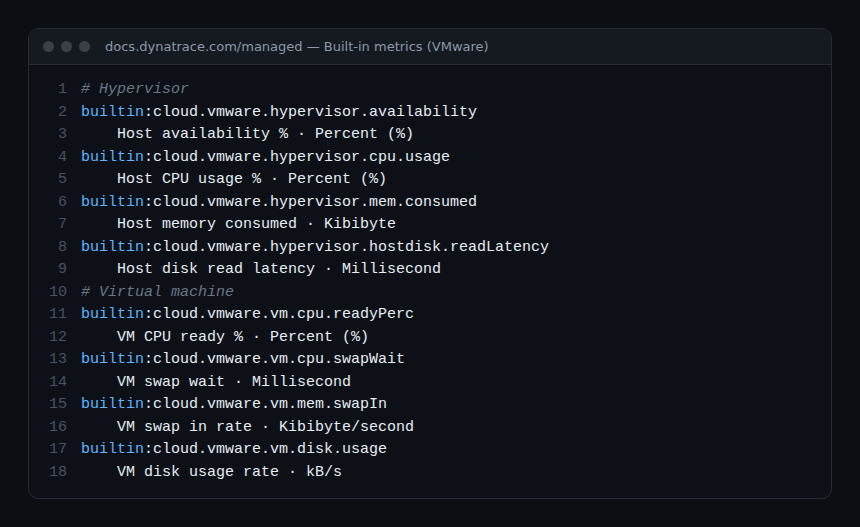
builtin:cloud.vmware.hypervisor.availability |
Percent (%) | avg | VMware (ESXi host) | ESXi host availability |
builtin:cloud.vmware.hypervisor.cpu.usage |
Percent (%) | avg, max, min | VMware (ESXi host) | ESXi host CPU |
builtin:cloud.vmware.hypervisor.mem.consumed |
Kibibyte | avg, max, min | VMware (ESXi host) | Memory consumed on the ESXi host |
builtin:cloud.vmware.hypervisor.mem.swapIn |
Kibibyte/second | avg, max, min | VMware (ESXi host) | Host swap-in rate |
builtin:cloud.vmware.hypervisor.hostdisk.readLatency |
Millisecond | avg, max, min | VMware (host disk) | Host disk read latency |
builtin:cloud.vmware.hypervisor.hostdisk.writeLatency |
Millisecond | avg, max, min | VMware (host disk) | Host disk write latency |
builtin:cloud.vmware.hypervisor.nic.packetsRxDropped |
Count | value | VMware (NIC) | Received packets dropped |
builtin:cloud.vmware.hypervisor.vms.count |
Count | avg, max, min | VMware (ESXi host) | Number of VMs per host |
builtin:cloud.vmware.vm.cpu.readyPerc |
Percent (%) | avg, max, min | VMware (VM) | VM CPU ready |
builtin:cloud.vmware.vm.cpu.usagePerc |
Percent (%) | avg, max, min | VMware (VM) | VM CPU as seen by the hypervisor |
builtin:cloud.vmware.vm.cpu.swapWait |
Millisecond | value | VMware (VM) | VM swap wait |
builtin:cloud.vmware.vm.mem.swapIn |
Kibibyte/second | avg, max, min | VMware (VM) | VM swap-in rate |
builtin:cloud.vmware.vm.disk.usage |
kB/s | avg, max, min | VMware (VM) | VM disk throughput |
builtin:cloud.aws.az.running |
Count | avg, max, min | AWS (availability zone) | Running EC2 instances per AZ |
builtin:cloud.azure.region.vms.running |
Count | avg, max, min | Azure (region) | Active VMs per Azure region |
builtin:cloud.azure.vmScaleSet.vms.stopped |
Count | avg, max, min | Azure (scale set) | Stopped VMs in a scale set |
builtin:cloud.openstack.vm.cpu.usage |
Percent (%) | avg, max, min | OpenStack (VM) | OpenStack VM CPU |
builtin:cloud.cloudfoundry.http.responses5xx |
Count | value | Cloud Foundry | Cloud Foundry 5xx responses |
builtin:tech.customDevice.count |
Count | value | Extensions (devices) | Number of custom devices |
builtin:tech.nginx.upstream.unhealthy |
Count | avg, max, min | NGINX Plus technology | Unhealthy NGINX Plus upstream servers |
builtin:tech.kafka.pg.kafka.server.ReplicaManager.UnderReplicatedPartitions.Value |
Count | avg, count, max, min, sum | Kafka technology | Under-replicated partitions (broker) |
builtin:tech.rabbitmq.cluster_messages_ready |
Count | avg, count, max, min, sum | RabbitMQ technology | Ready messages in the cluster |
How to read an entry
Same order as the other modules: the measurement, a use case, a pitfall, a selector. Selectors use no undocumented dimension: they sort and limit, and you add a splitBy once you have read the dimensions in the descriptor. Count metrics with the value aggregation are given without an aggregation transformation.
VMware: ESXi hosts
builtin:cloud.vmware.hypervisor.availability
Availability of the ESXi host as seen by the vCenter integration. Use case: an infrastructure SLO per vSphere cluster, or explaining a wave of unavailable VMs. Pitfall: the SaaS documentation lists this key among the VMware metrics not carried over to Grail; it is specific to classic metrics.
builtin:cloud.vmware.hypervisor.availability:avgbuiltin:cloud.vmware.hypervisor.cpu.usage
CPU usage of the hypervisor, all VMs combined. Use case: find out whether a slow VM suffers from a saturated physical host; read it with the VMs’ CPU ready. Pitfall: a host at 60% can already penalise VMs with many vCPUs; the global figure is not enough.
builtin:cloud.vmware.hypervisor.cpu.usage:sort(value(max,descending)):limit(10)builtin:cloud.vmware.hypervisor.mem.consumed
Physical host memory consumed by the VMs and the hypervisor. Use case: check the headroom before adding VMs or putting a host in maintenance (its VMs move to the others). Pitfall: the unit is the kibibyte; an unconverted chart looks a thousand times too large.
builtin:cloud.vmware.hypervisor.mem.consumed:sort(value(max,descending)):limit(10)builtin:cloud.vmware.hypervisor.mem.swapIn
Rate at which the host reads back into memory pages previously swapped to disk. Use case: sustained swap-in signals memory overcommitment that slows every VM on the host. Pitfall: a one-off swap-in after a past peak is not urgent; duration is what matters.
builtin:cloud.vmware.hypervisor.mem.swapIn:maxbuiltin:cloud.vmware.hypervisor.hostdisk.readLatency
Latency of reads on the disks and datastores seen by the host. Use case: decide whether a slow database comes from a bad query or from degraded shared storage. Pitfall: calibrate any fixed threshold on your storage array; no universal figure fits every medium.
builtin:cloud.vmware.hypervisor.hostdisk.readLatency:sort(value(max,descending)):limit(10)builtin:cloud.vmware.hypervisor.hostdisk.writeLatency
Counterpart of the previous one for writes. Use case: transaction logs and message queues are write-sensitive; a rise often explains slow commits. Pitfall: array write caches hide problems until they fill up, then latency jumps at once.
builtin:cloud.vmware.hypervisor.hostdisk.writeLatency:sort(value(max,descending)):limit(10)builtin:cloud.vmware.hypervisor.nic.packetsRxDropped
Packets received then dropped by the host’s physical NICs. Use case: high retransmissions on the process side (module 5) sometimes find their cause here. Pitfall: it is a counter; read it as a number of events per interval, not as a level.
builtin:cloud.vmware.hypervisor.nic.packetsRxDroppedbuiltin:cloud.vmware.hypervisor.vms.count
Number of virtual machines hosted. Use case: check cluster balance after a DRS operation or maintenance. Pitfall: the count says nothing about VM size; cross-check with host CPU and memory.
builtin:cloud.vmware.hypervisor.vms.count:maxVMware: virtual machines
builtin:cloud.vmware.vm.cpu.readyPerc
Share of time the VM was ready to run but got no physical CPU. It is the most direct measure of contention. Use case: a slow application whose guest CPU looks normal; high ready time shows it is waiting for the hypervisor. Pitfall: the guest OS cannot see this time; only the VMware integration exposes it.
builtin:cloud.vmware.vm.cpu.readyPerc:sort(value(max,descending)):limit(10)builtin:cloud.vmware.vm.cpu.usagePerc
CPU usage of the VM measured on the vSphere side. Use case: find oversized, almost idle VMs to shrink and free up the host. Pitfall: the value can differ from builtin:host.cpu.usage measured by OneAgent inside the guest; they are two viewpoints.
builtin:cloud.vmware.vm.cpu.usagePerc:sort(value(avg,ascending)):limit(20)builtin:cloud.vmware.vm.cpu.swapWait
Time the VM spends waiting for pages swapped by the hypervisor. Use case: confirms that host memory overcommitment does hit this VM. Pitfall: any lasting value is abnormal on a production VM; do not bury it in a daily average.
builtin:cloud.vmware.vm.cpu.swapWaitbuiltin:cloud.vmware.vm.mem.swapIn
Swap-in rate at VM level. Use case: identify which VMs pay for the overcommitment flagged by builtin:cloud.vmware.hypervisor.mem.swapIn. Pitfall: this is hypervisor swap, distinct from guest OS swap seen by OneAgent.
builtin:cloud.vmware.vm.mem.swapIn:sort(value(max,descending)):limit(10)builtin:cloud.vmware.vm.disk.usage
Disk I/O throughput of the VM. Use case: find the “noisy neighbour” VM saturating a shared datastore when host latency climbs. Pitfall: the documented unit is kB/s; check it in the descriptor before converting.
builtin:cloud.vmware.vm.disk.usage:sort(value(max,descending)):limit(10)Public and private cloud: AWS, Azure, OpenStack, Cloud Foundry
builtin:cloud.aws.az.running
Number of running EC2 instances per availability zone, from the AWS integration. Use case: check that an autoscaling group stays spread across zones, a condition for resilience. Pitfall: it is the only AWS key in the builtin: list; CloudWatch metrics of AWS services come from the cloud integration with their own keys, to be read in the metrics browser.
builtin:cloud.aws.az.running:maxbuiltin:cloud.azure.region.vms.running
Number of active VMs in an Azure region. Use case: follow a recovery plan that moves workloads from one region to another. Pitfall: only subscriptions configured in the Azure integration are counted.
builtin:cloud.azure.region.vms.running:maxbuiltin:cloud.azure.vmScaleSet.vms.stopped
Number of stopped VMs in a virtual machine scale set. Use case: a value that stays non-zero outside a maintenance window points to instances that fail to restart. Pitfall: read it with builtin:cloud.azure.vmScaleSet.vms.running to get the proportion.
builtin:cloud.azure.vmScaleSet.vms.stopped:maxbuiltin:cloud.openstack.vm.cpu.usage
CPU usage of VMs in an OpenStack private cloud, seen by the integration. Use case: spot saturated instances in a project with no agent in the guest. Pitfall: if OneAgent also runs in the VM, prefer its richer host metrics.
builtin:cloud.openstack.vm.cpu.usage:sort(value(max,descending)):limit(10)builtin:cloud.cloudfoundry.http.responses5xx
Number of 5xx responses, which the documentation describes as a sign of repeatedly crashing apps or response issues. Use case: a platform health indicator, to set against deployments. Pitfall: it is a raw count; divide it by builtin:cloud.cloudfoundry.http.totalRequests to get a rate.
builtin:cloud.cloudfoundry.http.responses5xxExtensions and integrated technologies
builtin:tech.customDevice.count
Number of custom devices created by extensions and integrations: network gear, appliances, third-party systems. Use case: check after an extension update that every expected device still reports. Pitfall: a silent drop is often an extension authentication issue, not a device failure.
builtin:tech.customDevice.countbuiltin:tech.nginx.upstream.unhealthy
Number of upstream servers flagged unhealthy by NGINX Plus. Use case: know that a load balancer is serving traffic with a depleted pool, before response times suffer. Pitfall: the metric covers NGINX Plus and needs the matching monitoring enabled; open source NGINX does not expose these counters.
builtin:tech.nginx.upstream.unhealthy:maxbuiltin:tech.kafka.pg.kafka.server.ReplicaManager.UnderReplicatedPartitions.Value
Number of partitions whose replicas are not all in sync on the broker. Use case: the most watched Kafka metric; a lasting non-zero value means one more broker failure could lose data. Pitfall: it rises briefly during a planned restart; alert on duration.
builtin:tech.kafka.pg.kafka.server.ReplicaManager.UnderReplicatedPartitions.Value:maxbuiltin:tech.rabbitmq.cluster_messages_ready
Number of messages ready for delivery and waiting for consumers, across the RabbitMQ cluster. Use case: a backlog that keeps growing signals consumers that are too slow or stopped. Pitfall: a stable high backlog may be intended (batch processing); compare with the usual trend.
builtin:tech.rabbitmq.cluster_messages_ready:maxHow to check it works
- In the environment settings, check that the integration is connected (vCenter, AWS, Azure) or that the extension is active, with no authentication error.
- Run the list request filtered by prefix to see the keys actually available in your environment:
curl -s -H "Authorization: Api-Token $DT_TOKEN" \
"https://managed.example.com/e/ENV-ID/api/v2/metrics?metricSelector=builtin:cloud.vmware.*&fields=unit,aggregationTypes"- Then paste a selector from an entry into Data Explorer (Code mode). An empty series while the key is listed usually means the monitored entity did not exist in the chosen timeframe.
Good practices
- Combine layers: CPU ready (VMware) +
builtin:host.cpu.usage(OneAgent) stops you jumping to an application cause. - Monitor collection itself: an integration that loses its permissions makes series vanish without alerting; tracking
builtin:tech.customDevice.countreveals it. - Cut noise by alerting on duration, as explained in the article on Davis alert noise.
Frequently asked questions
Do VMware metrics need an ActiveGate on Managed?
Yes: vCenter monitoring runs through an environment ActiveGate that queries the vSphere API. Check supported versions in the documentation for your Managed version.
Why are there so few builtin AWS keys?
The builtin: list only holds a few inventory counters. AWS service metrics come from the CloudWatch integration and can be found in the environment’s metrics browser.
Are extension metrics builtin too?
Some integrated technologies (Kafka, RabbitMQ, NGINX Plus) publish builtin:tech.* keys. Extensions you install publish their own keys, defined in their manifest.
From host to VM and cloud, you now have a checked key for every common operations question. The last module shows how to query these keys with the metric selector and the API, then turn them into alerts.
← Module 5: processes and containers · Course overview · Module 7: query and alert →
span.observer is an independent community blog, not affiliated with Dynatrace LLC. This module is an annotated selection: the reference remains the official documentation for your Dynatrace Managed version, where every key, unit and aggregation should be checked.