context-mode is a project that tackles the context window of coding agents: it keeps raw tool output out of the conversation, stores session state in a local database and routes calls through MCP and hooks. The mksglu/context-mode repository has around 30,200 stars in mid-October 2026, and its description claims support for 17 platforms.
The promise, a context that fills up more slowly, is also an operational promise: fewer input tokens per turn, lower cost, fewer compactions. But the README’s figures are the author’s own. This article presents the project, explains its licence precisely (it is not an open source licence), then offers a protocol for measuring the tokens saved yourself with OpenTelemetry. A note on honesty: span.observer did not install this software; the commands come from the README and the screenshots are excerpts rendered from that file.
context-mode: what the repository says
- Licence: Elastic License 2.0 (ELv2), detailed below; the 2026 copyright is in the name of the repository’s maintainer.
- Figures read on 16 October 2026: about 30,200 stars, about 2,100 forks, 2,235 commits; the
package.jsonon the main branch shows version 1.0.169 and requires Node.js 22.5 or newer. The releases page shows v1.0.169, dated 29 June (no year). - Mechanism: an MCP server exposing 11 tools (six sandbox tools, five meta-tools), and for Claude Code hooks (PreToolUse, PostToolUse, UserPromptSubmit, PreCompact, SessionStart, Stop).
It is a local tool, independent of Dynatrace, observed on the agent side: the reasoning holds for Dynatrace SaaS and Dynatrace Managed alike, since it relies on OpenTelemetry metrics.
The ELv2 licence: source-available, not open source
The README says so itself: the licence is “source-available”. The ELv2 text grants a worldwide, royalty-free, non-exclusive licence to use, copy, distribute, make available and prepare derivative works, subject to three limits:
- you may not provide the software to third parties as a hosted or managed service that gives users access to a substantial set of its features;
- you may not circumvent or disable any function protected by a licence key;
- you may not remove or obscure the licence and copyright notices.
The licence also includes a patent licence that ends if you claim in writing that the software infringes a patent, and automatic termination if you breach the terms. Nothing in these limits forbids internal use in your company. But a licence that restricts a field of use (here, offering it as a hosted service) does not meet the OSI’s open source definition: do not list it as such in a dependency inventory. If you plan to embed the software in a product or service offered to customers, have your legal team read the licence. This is not legal advice.
How context-mode works
The README describes four ideas. First the sandbox: the ctx_execute tool runs code in an isolated subprocess and only standard output enters the context; raw data (logs, API responses, snapshots) never leaves. Then the knowledge base: ctx_index chunks markdown into a SQLite FTS5 table and ctx_search queries it with BM25 ranking. Next session continuity: events stored in a per-project SQLite database and restored after compaction. Finally hook routing, which redirects calls that would flood the context to the sandbox.
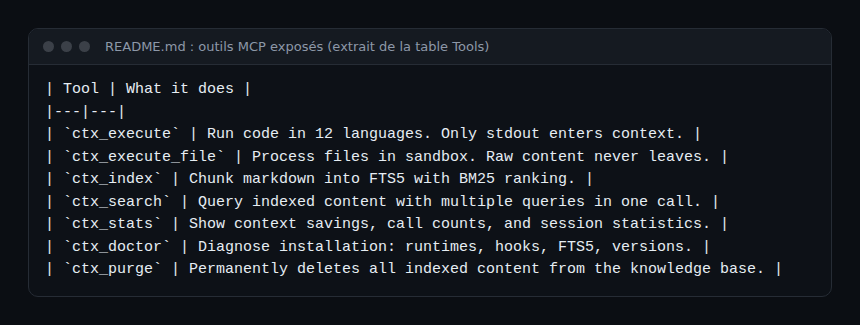
The project also presents itself as letting “nothing leave the machine”: no telemetry, no cloud sync. The same README nevertheless describes a ctx insight command that opens a hosted dashboard: check what really travels before enterprise use.
Step-by-step installation
Step 1 — Install on Claude Code
The README asks for Claude Code 1.0.33 or newer, then gives two plugin commands and a diagnostic command. It also offers an MCP-only installation, without hooks or automatic routing:
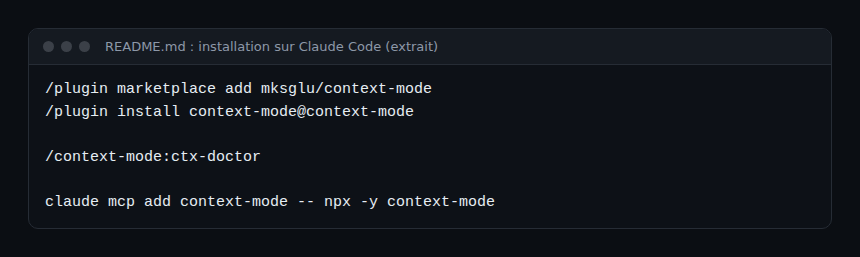
The /context-mode:ctx-doctor diagnostic validates the runtimes, the hooks, FTS5 and plugin registration. For other clients (Gemini CLI, Cursor, Codex CLI…), the README gives a global npm install -g context-mode followed by a configuration file specific to each client.
Step 2 — Enable the agent’s telemetry
The ctx_stats figures come from the tool itself. For an independent figure, measure at the source, on the agent side. Claude Code exports the claude_code.token.usage metric through OpenTelemetry, broken down by type: input, output, cacheRead and cacheCreation. input excludes tokens read from or written to the prompt cache. For a local test without a backend, the console exporter is enough:
export CLAUDE_CODE_ENABLE_TELEMETRY=1
export OTEL_METRICS_EXPORTER=console
export OTEL_METRIC_EXPORT_INTERVAL=10000
claude
To send to Dynatrace, reuse the OTLP configuration from supervising a coding agent in the enterprise (OTLP over HTTP, delta-temporality metrics). The metric key may receive a suffix at ingestion: check it before building a tile.
Step 3 — Compare two sessions
Pick a reference task that produces a lot of output (analysing a large log, walking through Git history). Run it in a fresh session with the plugin disabled, then in a fresh session with the plugin active, with the same repository, model and prompt. Repeat several times: an LLM is not deterministic.
timeseries tokens = sum(claude_code.token.usage), by:{type}, interval:5mAdd up the four types, not just input, otherwise a shift of tokens to the cache passes for a saving. The basics of this syntax are in our DQL filter, summarize and timeseries cheat sheet (Dynatrace SaaS; on Dynatrace Managed, use the metric selector).
Step 4 — Look at the size of tool results
The claude_code.tool_result event carries tool_name, duration_ms and tool_result_size_bytes. Compare result sizes between the two sessions: with the sandbox, calls that used to return tens of kilobytes should return a few hundred bytes.
What the README’s figures do not prove
The README claims savings of 94 to 100% depending on the scenario, which is consistent with the mechanism described, but these are the author’s measurements on the author’s scenarios.
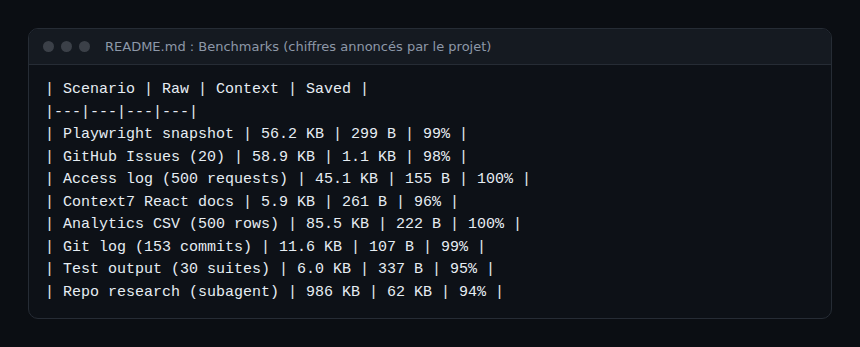
Your net result depends on your workload. You must subtract the fixed cost: 11 MCP tool definitions and instructions injected by the hooks, present on every turn. A task that produces little output may gain nothing. That is the point of measuring: an agent’s cost reads in tokens per task, as in our article on AI agent cost, and window size is a model-selection criterion, see choosing an LLM. If your agent is not Claude Code, the gen_ai.usage.* attributes and a platform such as Langfuse play the same role.
Limits and open points
- ELv2 licence: no hosted-service offering, no “open source” label.
- The software sits in the tool-call loop through hooks: it is a critical component to watch, like any MCP server (see securing an MCP server).
- Session state and the index live in SQLite in your user folder: include them in your data thinking (
ctx_purgedeletes them). - Agent memory is a wider subject, see Hindsight, and the project lists the OpenClaw ecosystem among its supported clients.
How to check that it works
/context-mode:ctx-doctorshows every check ticked.- Analysing a large file goes through
ctx_executeorctx_execute_fileand returns only the useful output. - In your metrics, the sum of tokens per task falls on the reference task, without degrading the result.
Best practices
- Measure before adopting: three to five repetitions per configuration.
- Compare at equal quality: a smaller context is worth nothing if the agent gets things wrong more often.
- Record the licence in your dependency inventory and pin the version.
Frequently asked questions
Is context-mode open source?
No, not in the OSI sense. The code is readable and modifiable under ELv2, but the licence forbids offering it as a hosted service.
Can context-mode be used in a company?
The licence text allows internal use. Have your legal team validate the case of a product or customer-facing service.
How do I know how many tokens it saves?
Compare sessions with and without the plugin using claude_code.token.usage, summing all token types, rather than relying on ctx_stats alone.
Conclusion
context-mode offers a simple idea, keeping raw data out of the context, and implements it with MCP tools and hooks. Its figures are the author’s; measuring with OpenTelemetry turns them into your own. Source: the mksglu/context-mode repository.
span.observer is an independent community blog, not affiliated with Dynatrace LLC or with the projects mentioned. Trademarks belong to their owners. Tools change quickly: check commands and options in their official documentation.