A Ghidra MCP server is a good case study for connecting an AI agent to a local tool. The open source GhidraMCP project (Apache 2.0 licence) exposes the functions of Ghidra, the NSA’s binary analysis tool, to any MCP client: list a program’s functions, decompile, follow cross-references, rename symbols. Defensive security teams use it to speed up the analysis of their own binaries or of samples in a lab.
For operations, the question is not “what can the agent do?” but “what can it touch, and how do we know what it did?”. A local MCP server runs with the user’s rights, reads files, and some of its tools change the state of the project. This guide shows how to isolate this kind of integration and trace every tool call, without covering anything offensive.
Nothing here depends on Dynatrace. If you send agent traces to Dynatrace SaaS or Dynatrace Managed, the traceability part relies on the same OpenTelemetry conventions as our article on monitoring MCP agents.
How the Ghidra MCP server works
GhidraMCP has two parts:
- a Ghidra plugin that opens a small HTTP server. Its code listens only on
127.0.0.1and accepts only the host names127.0.0.1,localhostand[::1]; - a Python MCP server (
ghidra-mcp) that translates MCP tool calls into requests to that plugin. By default it targetshttp://127.0.0.1:8080/.
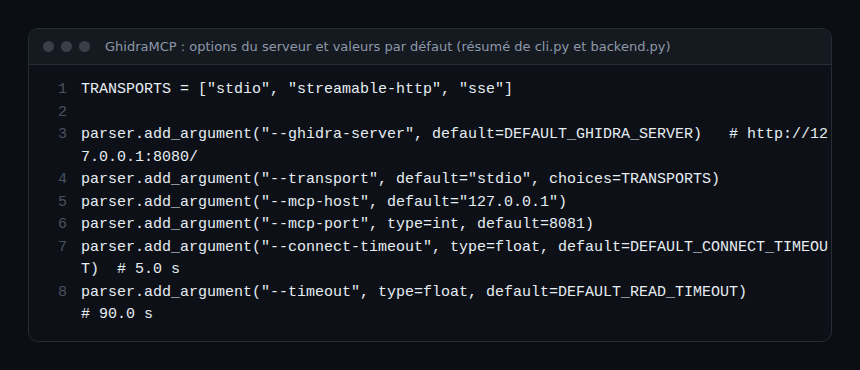
The MCP server supports three transports: stdio (the default, where the client launches the process), streamable-http and sse, the last one being deprecated. Over HTTP it listens on 127.0.0.1:8081 by default. A headless mode avoids the GUI: ghidra-mcp imports and analyses the binary itself with PyGhidra.
If MCP is new to you, start with the Model Context Protocol explained.
Inventory what the agent can do
Before connecting anything, list the exposed tools and sort them by effect. GhidraMCP declares about thirty of them with @mcp.tool(). Most read; eight modify the Ghidra project (renaming, types, comments).
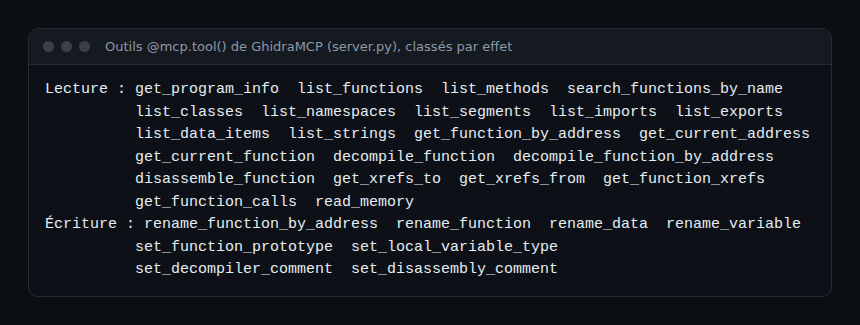
The MCP specification defines tool annotations (readOnlyHint, destructiveHint, idempotentHint, openWorldHint) to signal these effects to the client. GhidraMCP does not set them, and the specification states anyway that they are only hints: a client must not rely on them when the server is not trusted. Your own classification is what counts.
In practice: isolating a Ghidra MCP server
Step 1 — Keep everything local
Prefer the stdio transport: no port is opened, and the client starts and stops the process. If you must use streamable-http, leave --mcp-host at 127.0.0.1. Never expose that port on the network: an MCP server has no authentication by default, as explained in securing an MCP server.
Step 2 — Work on a copy, in headless mode
Headless mode makes the analysis reproducible and easy to contain. Without --project, GhidraMCP uses a temporary project and discards changes on exit (--discard is the default in that case). Mount the binary read-only and cut the container off from the network:
docker run -i --rm --network none \
  -v "$PWD/samples:/work:ro" \
  internal-ghidra-mcp-image \
  ghidra-mcp --headless --binary /work/program-to-analyse --discard
You build the image yourself (Ghidra, Java and the GhidraMCP extension): the project does not publish a container image. --network none ensures that an analysed sample or a misused tool cannot reach anything. The MCP client talks over standard input and output thanks to -i.
Step 3 — Keep a human in the loop for writes
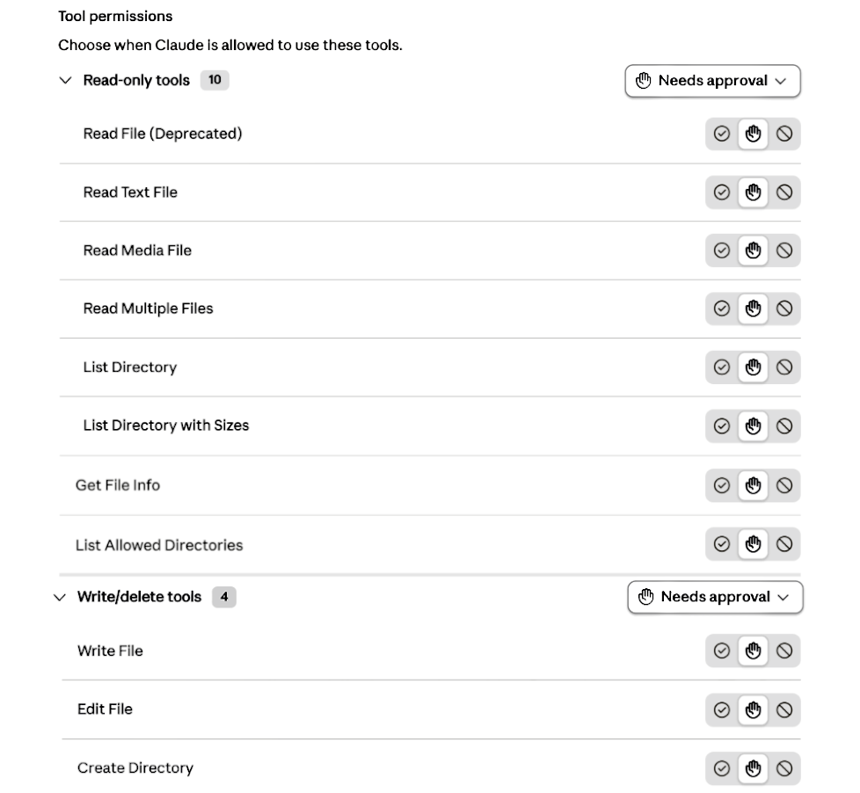
The MCP specification recommends that a human can always deny a tool call and that the client clearly shows which tool is being called. Approve the eight write tools case by case; allow only read tools permanently, and only after the inventory. Some clients already group tools by effect, as in the example below with another local MCP server.
Tracing every tool call
GhidraMCP writes its logs to standard error at INFO level: start-up, connection to Ghidra, binary import and analysis. It does not log each tool call. Traceability therefore has to come from the agent or the client:
- The agent’s OpenTelemetry traces: the OpenTelemetry MCP semantic conventions (status Development) name the span
{mcp.method.name} {target}, for exampletools/call decompile_function, with the attributesmcp.method.name,mcp.session.idandgen_ai.tool.name. Client-side duration is measured with themcp.client.operation.durationhistogram. - The server’s stderr logs: redirect them to a file or to your log collector to keep a record of start-ups and backend errors.
- The MCP Inspector during development: it shows each
tools/callmessage, its parameters, its response and its duration.
With these traces, an audit question (“which agent renamed this function, and when?”) is answered by a span search instead of a manual investigation. To instrument a server yourself, see building an MCP server in Python.
How to check that it works
- At start-up, standard error contains an
INFO:ghidra_mcp.headless:Analyzing …line followed byServing …. - From inside the container, a network connection attempt fails:
--network noneis in effect. - In your trace backend, a
tools/callcall appears withgen_ai.tool.nameset, and a write tool only appears after approval.
Best practices
- One MCP server per scope: one binary, one container, one session.
- Re-run the tool inventory at every server update: a new version may add a write tool.
- Set time limits:
--timeout(90 s by default) bounds the backend wait,--ready-timeout(30 s) the analysis wait in headless mode. - Never pass secrets as tool arguments: they end up in traces.
- Only analyse binaries you are entitled to analyse, in a lab environment.
Frequently asked questions
Does the Ghidra MCP server work with any MCP client?
The README says any MCP client should work in theory, and gives examples for VS Code and Claude Code. Clients that connect through a URL use the streamable-http transport.
Is the Ghidra GUI required?
No. Headless mode (--headless --binary) runs Ghidra in-process through PyGhidra. It needs Python 3.10 to 3.13 and the GhidraMCP extension installed.
Are readOnlyHint annotations enough to block writes?
No. They are hints provided by the server. Real control happens on the client side (approval, allowed tool list) and through process isolation.
Conclusion
Connecting an agent to a local tool such as a Ghidra MCP server calls for the same rigour as production access: tool inventory, least privilege, network isolation, a human in the loop for writes and usable traces. Sources: GhidraMCP repository and the MCP tools specification.
span.observer is an independent community blog, not affiliated with Dynatrace LLC or the projects mentioned. Trademarks belong to their respective owners. Tools change quickly: check commands and options in their official documentation.