Elastic APM RUM agent monitoring shows what your users experience in the browser: load times, XHR calls and navigations. For an SRE, it covers the part of the journey that server metrics cannot see. According to Elastic’s documentation, Real User Monitoring “captures user interaction with clients such as web browsers”, using Elastic’s JavaScript agent.
This tutorial enables it end to end: on the APM Server, in the web page, then in the UI. It also states what the documentation confirms about navigation metrics. Nothing here is a span.observer measurement: the behaviours described come from Elastic’s documentation, read on 30 October 2026.
In short
- RUM is disabled by default on APM Server: set
apm-server.rum.enabledtotrue(or tick “Enable RUM” in Fleet). - The agent runs in the browser, so anonymous authentication is required.
- The npm package is
@elastic/apm-rum. It createspage-load,route-changeanduser-interactiontransactions. - The reference page also lists Core Web Vitals (LCP, INP, CLS, FID), with browser support limits.
Elastic APM RUM agent: the problem and the goal
A service can answer in 80 ms on the server and still feel slow on screen. The lost time hides in DNS, connection setup, document parsing or script execution. Without browser-side measurement, a platform team debugs blind.
The goal is simple: get one page-load transaction per visit, with its Navigation Timing spans, in Elastic APM. This is not server tracing. A classic APM agent watches requests and responses; the RUM agent watches the experience inside the client application.
One compatibility point. According to the agent’s introduction page, it is not compatible with Elastic Cloud Serverless, because it cannot send data to serverless APM endpoints. This article assumes a self-managed or Fleet-managed APM Server.
Prerequisites
- A centralised APM Server: standalone binary or Fleet-managed. The documentation requires it for RUM.
- Access to the APM Server configuration (
apm-server.ymlor the Fleet agent policy). - A front-end web application. The agent is “framework-agnostic”, so any JavaScript framework works, per Elastic.
- A recent browser for testing. Support varies by metric (see below).
Versions: the “current” Elastic documentation pages I read do not fix an agent version. Note the version of @elastic/apm-rum installed in your project. This is not verified here.
Step 1: enable RUM on APM Server
According to the RUM configuration page, the feature is disabled by default. With the binary, you declare it in apm-server.yml. With Fleet, open the agent policy, edit the Elastic APM integration and enable “Enable RUM” in the Real User Monitoring section.
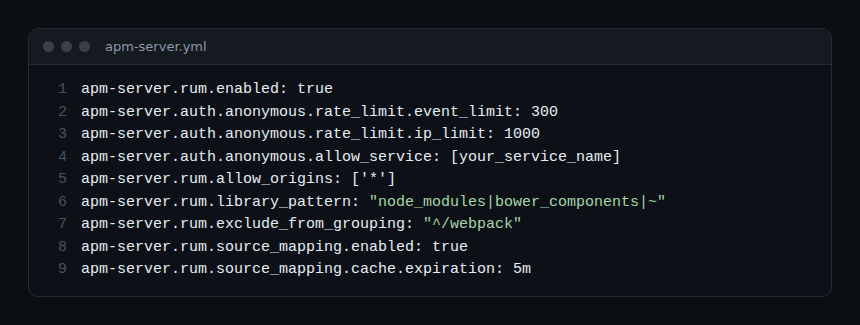
This block follows the documentation example, without the API key. The lines to understand:
apm-server.rum.enabled: true: turns on the RUM endpoint (defaultfalse).apm-server.auth.anonymous.rate_limit.event_limitandip_limit: cap the rate of anonymous events. The documentation example uses 300 and 1000; it lists no default value.apm-server.auth.anonymous.allow_service: restricts accepted service names. Put your front end’sserviceNamethere.apm-server.rum.allow_origins: default['*'], every origin. In production, list your origins.apm-server.rum.source_mapping.enabled: defaulttrue; reading source maps needs extra privileges.
Another useful point: if an API key or secret token is configured, enabling RUM automatically enables anonymous authentication. The documentation explains why: the RUM agent runs in the browser, so it cannot keep a secret.
For reliability, this is a trade-off to own. The endpoint is public. Rate limits and allow_service protect your error budget, and your storage, from noise or abuse.
Step 2: install the RUM agent in the application
With a bundler, install the package, then initialise the agent as early as possible. This is the documentation’s initialisation, with example values.
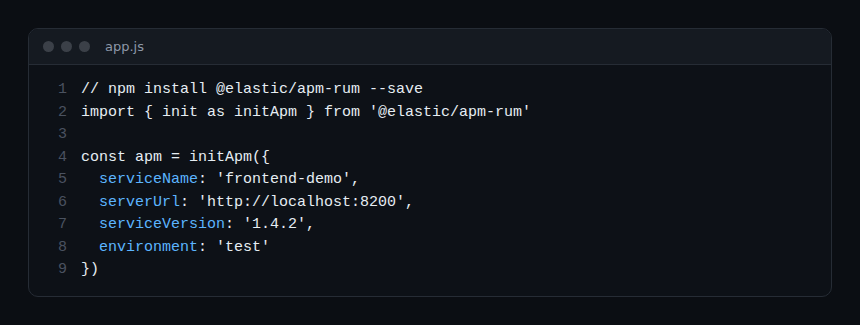
The useful options, per the configuration page:
serviceName: required, no default; letters, digits, spaces, underscores and dashes only.serverUrl: defaulthttp://localhost:8200. Replace it with your APM Server URL.serviceVersion: application version or git reference; APM Server uses it to find the matching source map.environment: production, test and so on. It acts as a global filter in the APM app.transactionSampleRate: default1.0, so every transaction is sampled.distributedTracingOrigins: default[]. Listed origins receive thetraceparentheader.
Without a bundler, the documentation also offers a script tag loading the UMD bundle from unpkg, then elasticApm.init({ serviceName, serverUrl }). For production it recommends hosting the file on your own server or CDN. With asynchronous loading, distributed tracing does not work for requests made before the agent initialises.
Step 3: configure CORS if the origins differ
If the APM Server does not share the page’s origin, the browser sends an OPTIONS preflight before the POST. The documentation notes that it fails if RUM is not enabled on the APM Server. In that case, list the allowed origins with apm-server.rum.allow_origins.
If a proxy sits in front of the APM Server, it must answer the preflight with Access-Control-Allow-Headers: Content-Type, Access-Control-Allow-Methods: POST, OPTIONS and Access-Control-Allow-Origin set to the request origin. With the sendCredentials option, it also needs Access-Control-Allow-Credentials: true. To understand this kind of error better, read our guide on the XHR request and CORS blocks.
Read the navigation metrics
Once the page is reloaded, the agent sends a page-load transaction. According to the documentation, it covers the page and its resources, measured from fetchStart. Its spans follow the Navigation Timing API.
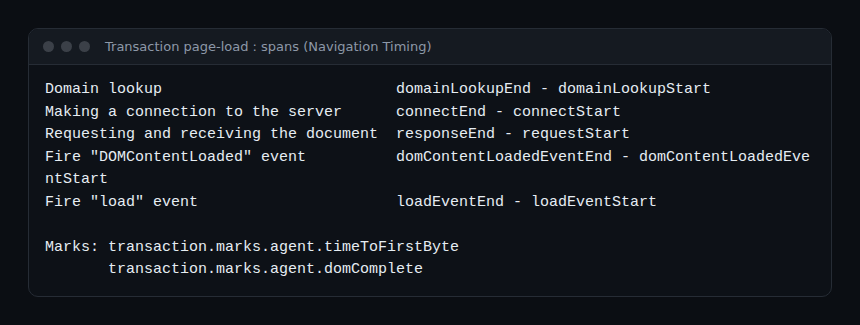
In practice, you read:
- DNS resolution, TCP connection (TLS included) and server response;
- document parsing and synchronous script execution;
- the
DOMContentLoadedandloadevents; - Time to First Byte, stored in the
transaction.marks.agent.timeToFirstBytemark.
The page-load duration can extend past the browser’s load event. For an accurate reading of that event, use the “Fire load event” span or the transaction.marks.agent.domComplete mark.
The other transaction types are user-interaction (clicks; a transaction without spans is discarded) and route-change (a click that changes route). Single-page applications’ pushState events are captured too.
What about Core Web Vitals?
The introduction page lists “FCP, LCP, INP, FID” among user-centric metrics. The reference page also details CLS, TBT and long tasks. But support depends on the browser:
- FCP: Chromium-based browsers (Chrome > 60, Edge > 79, Opera > 47);
- LCP: Chrome > 77 only;
- FID: Chrome > 85 only;
- INP, CLS, TBT: the page lists no support.
So do not assume uniform coverage. Always compare with what your real traffic produces.
How to check that it works
- Reload the page with the browser developer tools Network tab open. Look for a
POSTto yourserverUrl. A 2xx status is expected. - If you see a preflight failure, go back to step 3: is RUM enabled? Is the origin allowed?
- In Kibana, open Observability > APM and look for your
serviceName. Filter on thepage-loadtransaction type. The exact menu path depends on your version: not verified here. - Open a transaction and check the spans from screenshot 3, plus the
timeToFirstBytemark.
Best practices
- Restrict
allow_originsandallow_serviceas soon as you go to production. - Set
serviceVersionandenvironmentto tie errors to deployments and source maps. - Keep
transactionSampleRateat1.0at first, then lower it if volume strains storage. - Define a navigation SLO from the values you actually observe, not theoretical thresholds.
- Host the agent bundle yourself rather than on unpkg.
How does this relate to OpenTelemetry and Dynatrace?
The @elastic/apm-rum agent is Elastic’s own agent, not an OpenTelemetry SDK. Data goes to the APM Server through its ingestion protocol. If your strategy rests on OpenTelemetry, compare the data-model differences first. Our article on OpenTelemetry and Prometheus shows how to reason about open standards that complement each other.
If you use Dynatrace, RUM works differently there, with the platform’s own JavaScript agent. Our article on Dynatrace RUM and Core Web Vitals covers that approach for Dynatrace SaaS; the Dynatrace vs Datadog comparison places these choices in a wider context. No integration between the Elastic RUM agent and Dynatrace is documented: do not assume one.
Finally, keep the gap between measurement and overall supervision in mind: it is explained in observability vs monitoring.
Frequently asked questions
Is Elastic APM RUM enabled by default?
No. The APM Server documentation states that RUM is disabled by default. Set apm-server.rum.enabled: true, or enable “Enable RUM” in the Elastic APM integration in Fleet.
Why is anonymous authentication needed?
The RUM agent runs in the user’s browser, so any secret would be visible. When an API key or secret token exists, enabling RUM automatically enables anonymous authentication. Limit it with allow_service and rate caps.
Does the agent measure Core Web Vitals?
Elastic’s documentation describes LCP, INP, CLS and FID, with browser limits: LCP and FID are listed for Chrome only, for example. Check the values on your own traffic before setting an SLO.
Conclusion
Enabling Elastic APM RUM takes three steps: apm-server.rum.enabled: true, initialise @elastic/apm-rum with serviceName and serverUrl, then handle CORS. The value then comes from reading page-load transactions and their spans. Start with one pilot service and set a first navigation objective.
This article is published by span.observer, an independent blog, not affiliated with Dynatrace LLC or Elastic N.V. The information comes from Elastic’s official documentation, read on 30 October 2026: installing the RUM agent and APM Server RUM configuration. Check them before any production rollout.