Friday, 4 pm: the cluster maintenance window is booked for Saturday morning and version 1.350 has just appeared in the console. Before anyone clicks, the on-call engineer has one question: what could this upgrade break on my side? The Dynatrace Managed 1.350 release notes read faster when you scan them with that question in mind instead of line by line. Dynatrace also covers the version in its release-notes post.
So I sort the content into three piles: what needs action from you, what happens by itself during the cluster update, and what lands in the settings but changes nothing until you switch it on. Everything below concerns Dynatrace Managed only.
Reading frame. I have not applied this version to a cluster: everything comes from the official Managed 1.350 notes page, read on 10 November 2026. Points I could not verify are flagged in the text.
Dynatrace Managed 1.350: one mandatory action
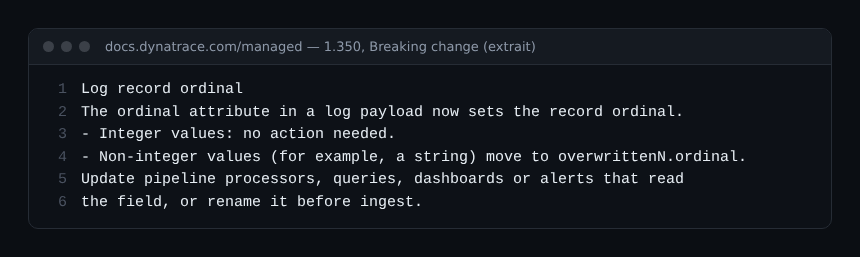
The page has no upgrade-instructions section. The only item that needs you is the breaking change on logs: the ordinal attribute of a log payload now sets the record ordinal. If the value is an integer, do nothing. If it is anything else, a string for instance, it is moved to an overwrittenN.ordinal attribute, and the index N cannot be predicted.
In practice, search your pipeline processors, queries, dashboards and alerts for any read of the ordinal field. You have two ways out: adapt those consumers, or rename the field before ingestion, which avoids the unpredictable index. The notes do not tell me how many real pipelines depend on it: that inventory has to happen on your side.
What sorts itself out: the cluster components
The second pile is reassuring for a short window. According to the page, Elasticsearch moves to 8.19.18 through rolling updates, with no manual step and no downtime. OpenSSL goes to 3.5.9 in the Managed installer and in NGINX, which moves to 1.30.5. On the security side, the notes mention Java 21.0.13+9 and 17.0.21+9, plus the removal of trust for compromised intermediate certificates from an issuer named on the page (reference CVE-2026-114820). I did not look into that reference: read the source before drawing a risk level from it.
For an upgrade, these lines serve one purpose: ticking, in your change ticket, that the vendor updates the dependencies. To review the general mechanics, reread the article on Managed cluster updates.
Fixes that matter to whoever runs the cluster
Three fixes hit cluster operators directly and are worth knowing before you meet them in an incident:
- adding a node to a Premium high-availability cluster failed because of a wrong seed-node choice (PRISM-15770);
- the Cluster Management Console wrongly reported a connectivity problem with an embedded ActiveGate when
dnsEntryPointpointed to a host missing from the node’s communication URIs (PRISM-15764); - after a backup restore, features such as the Hosts page or Data Explorer filtering now come back shortly afterwards, where they could stay unavailable for up to five days.
If your last restore test left those screens empty, that is a good reason to rerun it after the upgrade. For the diagnostic method, see troubleshooting a Managed cluster.
Metrics: limit alerts, off by default
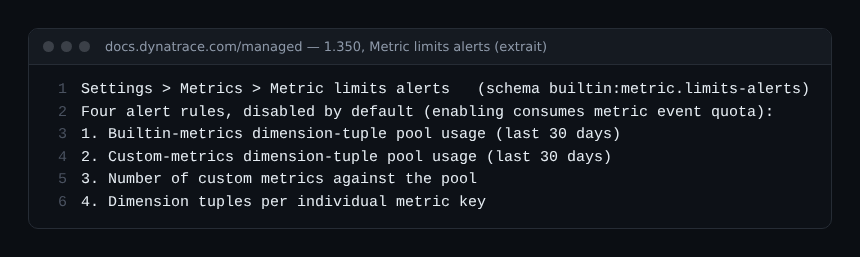
The most useful addition for a growing cluster is the metric limits alerting, under Settings, Metrics, “Metric limits alerts”, and through the Settings API with the builtin:metric.limits-alerts schema. Existing configurations are migrated automatically. Four rules watch:
- the use of the dimension-tuple pool for built-in metrics over 30 days;
- the same for custom metrics;
- the number of custom metrics against the pool;
- the number of dimension tuples per metric key.
All four rules are disabled by default, and enabling them consumes metric event quota. An operating decision: enable the per-metric-key rule first, since it names the culprit, rather than the three pool rules that only say the ceiling is near. Along the same lines, the number of custom dimensions kept in the 30-day sliding window has doubled, caching of dimension queries is better and the reasons for rejection at high ingest rates are clearer.
One more operator appears in Data Explorer advanced mode: asHistogram(<buckets>) shows a non-histogram metric as a histogram, with at most 12 buckets; existing visualisations are unchanged. See the Data Explorer guide for Managed.
Topology, API and monitoring: three changes to test
Resource attributes enter the topology model: they show in the properties section of entity screens and can be used in monitored-entity rules and auto-tagging rules for hosts, processes, process groups, containers and container groups. Custom attributes can also be set on monitored hosts and Kubernetes clusters through the dt_metadata.properties file. That reduces the need for hand-placed tags, but I have not checked the behaviour on a real estate.
On the API side, the OneAgent auto-update on a host (PUT /hosts/{id}/autoupdate and the validator POST /hosts/{id}/autoupdate/validator) now accepts only versions higher than the installed one. An equal or lower version returns 400 Bad Request with both versions in the message. If a fleet script “downgrades” agents, it will now fail: see the Managed API endpoints.
Finally, static Go monitoring works on Linux without the ptrace capability and is meant to replace the opt-in OneAgent feature “Go improved static monitoring” in time. Shadow DOM support arrives in the Synthetic recorder, with limits: at most 15 nested boundaries, only the host is recorded for a closed shadow root, and iframes inside a shadow root are not handled.
Operating systems: note the dates before the next change
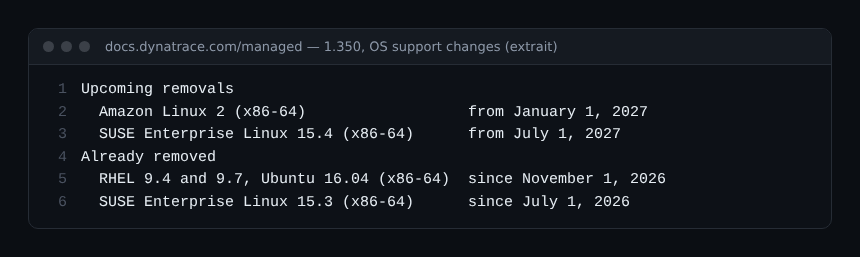
The page lists support removals. Already in effect: Red Hat Enterprise Linux 9.4 and 9.7 and Ubuntu 16.04 (x86-64) since 1 November 2026. Coming: Amazon Linux 2 (x86-64) on 1 January 2027 and SUSE Enterprise Linux 15.4 (x86-64) on 1 July 2027. If a node or a monitored host runs one of these distributions, open the ticket now rather than at the deadline.
Maintenance-window checklist
- List everything that reads the log
ordinalfield, before the upgrade. - Check the distribution of each node and monitored host against the removal dates.
- Start the cluster update, then check each node’s state in the console.
- Rerun a restore test and check the Hosts page.
- Decide which limit alert rules to enable, starting with the per-metric-key one.
- Check the scripts that call the OneAgent auto-update API.
Best practices
- Read the notes with an operating question, not as a catalogue of novelties.
- Separate what is automatic from what needs a human decision in the change ticket.
- Enable the limit alerts one at a time to measure their cost in event quota.
- Keep the link to the official page in the ticket: notes can be corrected after publication.
Frequently asked questions
Does version 1.350 require an action before the update?
According to the page I read, the only required action is reviewing the log ordinal attribute. The notes have no upgrade-instructions section. Still, check the page on the day of your change.
Are the metric limit alerts active after the upgrade?
No: the four rules are disabled by default and enabling them consumes metric event quota. Existing configurations are migrated automatically.
Do these notes apply to Dynatrace SaaS?
No, this article covers Managed only. The versions and components described are those of the Managed 1.350 page; do not carry anything over to SaaS without reading its own notes.
Conclusion
For the operator, the Managed 1.350 release notes boil down to a log check, an operating-system check and a few optional settings. The rest of the components update with the cluster. Do this reading before the maintenance window, not during it.
This blog is independent and not affiliated with Dynatrace LLC. The information comes from public documentation and may change; check it in your own environment.