Elastic Observability cost sizing starts from two volumes only: what you send to the Serverless project each month, and what you keep in it. For an SRE or platform team, the job is to estimate both numbers before connecting sources, then to watch them. This article gives the method, the figures read in Elastic’s documentation and a worked example you can redo with your own volumes.
No price here comes from a third-party site. The rates quoted were read on Elastic’s official page on 30 October 2026 and may change: check them again before any budget.
In brief
- Two volume dimensions: ingest (GB sent during the month) and retention (GB stored).
- The billed volume is the fully enriched, normalised data at the end of the ingest pipeline, before Elasticsearch compression.
- According to the documentation, the choice of collection agent, OpenTelemetry included, does not change the cost.
- Retention is set per data stream (
data_retention): it is the simplest lever.
How Elastic Observability Serverless cost is calculated
The Observability billing dimensions page describes two data dimensions. Ingest is “measured by the number of GB of data that you send to your Observability project over the course of a month”. Retention is “measured by the total amount of ingested data stored” in the project. Logs and traces are priced at the standard rate; they are not separate billing lines.
Metrics are an exception. According to the same page, metrics stored in time series index mode are priced at 25% of the standard per-GB retention rate, and the same factor applies to their ingest. Published metrics pricing has changed: the pricing page mentions new pricing effective 1 July 2026.
What the ingest volume actually measures
According to this documentation, the volume is based on the “fully enriched normalized” data size at the end of the ingest pipeline, before Elasticsearch compression. In practice, the billed volume can exceed the index size on disk, and the volumes seen in a cloud provider’s proxy logs. So do not size from the index sizes of an old cluster or from network traffic.
One reassuring point for teams standardising on OpenTelemetry: the page states that the ingest architecture (Elastic Agent, Logstash, OpenTelemetry or other collectors) does not affect cost. We covered these paths in our article on Elastic Agent and the OpenTelemetry collector.
Published rates, with date and caveats
The Serverless Observability pricing page, read on 30 October 2026, shows two feature tiers. Amounts are in dollars (“$”); the page does not name the currency.
| Tier | Ingest (logs, traces, other) | Retention (logs, traces, other) |
|---|---|---|
| Logs Essentials | as low as $0.07 per GB | as low as $0.017 per GB per month |
| Complete | as low as $0.09 per GB | $0.019 per GB per month |
For metrics, the page shows $0.023 per GB ingested and $0.005 per GB per month retained in the Complete tier. Mind the wording “as low as”: these are displayed floors, not a guaranteed price for your volume. Any calculation using them is therefore a low estimate. For a firm budget, use Elastic’s calculator or sales team.
Elastic Observability cost sizing step by step
Here is a four-step method. It applies to an Observability project on Elastic Cloud Serverless; it concerns neither Dynatrace Managed nor Dynatrace SaaS.
- Measure the raw volume per source. Count GB per day for each source (application logs, traces, metrics) before compression, including the enrichment your pipelines add.
- Multiply by 30 to get monthly ingest.
- Decide retention per data type. Debug traces do not need the same duration as audit logs.
- Compute the stored stock: daily volume times the number of days kept, once steady state is reached.
Example with 50 GB per day of logs in the Complete tier, at the floor rates above. Ingest is 1,500 GB per month, or $135. With 30 days of retention, the stock reaches 1,500 GB, or $28.50 per month; with 90 days, 4,500 GB, or $85.50 per month.
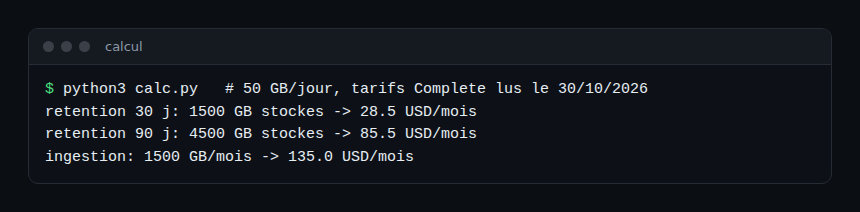
The calculation shows a useful order of magnitude: going from 30 to 90 days triples the stored stock but leaves ingest unchanged. Here, ingest weighs more than retention. Reducing the volume sent is therefore the first lever, retention the second. This result comes from our arithmetic on floor rates, not from a measurement.
We did not verify whether retention counts the same “enriched” volume as ingest or the compressed size: the documentation we read does not say. Allow a margin and compare your first invoice with your estimate.
Set retention in an index template
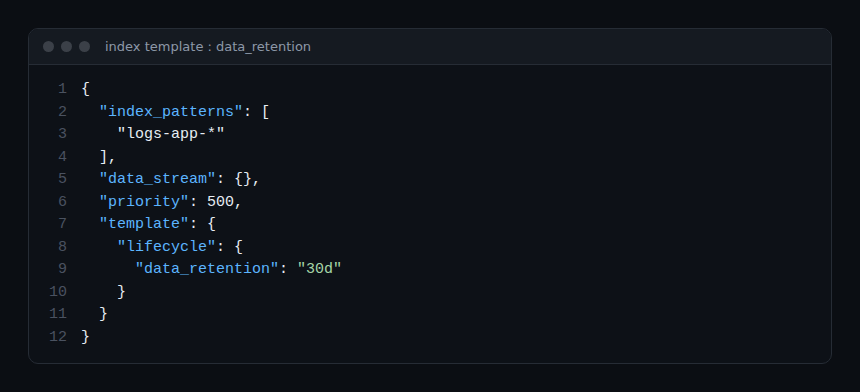
According to the data stream retention documentation, the data_retention parameter is set per data stream. For new streams, put it in an index template; the logs-app-* name below is an example.
{
  "index_patterns": ["logs-app-*"],
  "data_stream": {},
  "priority": 500,
  "template": {
    "lifecycle": {
      "data_retention": "30d"
    }
  }
}
Change an existing stream
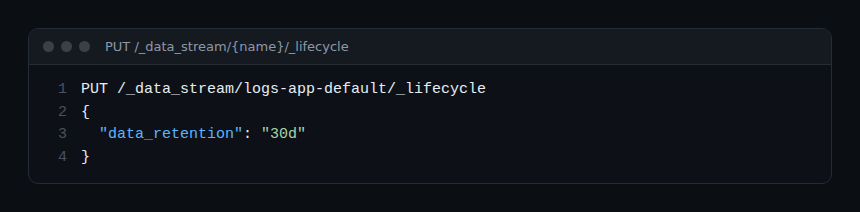
For a stream that already exists, the Elasticsearch Serverless API reference gives the request PUT /_data_stream/{name}/_lifecycle. The data_retention parameter sets the minimum time documents are kept; an empty value keeps them indefinitely.
PUT /_data_stream/logs-app-default/_lifecycle
{
  "data_retention": "30d"
}
In Kibana, the Streams page also offers a Retention tab to review and adjust a stream’s retention. With no setting, effective retention is infinite: that is the documented default, and therefore a cost risk that grows silently. The cluster-wide settings data_streams.lifecycle.retention.default and data_streams.lifecycle.retention.max appear in the documentation page; we did not verify their availability on a Serverless project, which may not expose cluster settings. The page also says searchable snapshots (frozen_after) are unavailable on Serverless: the frozen tier described in our frozen tier article does not apply here.
How to check that it works
- Query the stream with the Get data stream lifecycle API: the response should show
"lifecycle": {"enabled": true}and yourdata_retention. - Once a week, compare the volume sent with that day’s estimate. A lasting gap points to an overly verbose source.
- After the first full month, compare the invoice with your calculation and adjust the margin factor.
Best practices for controlling cost
- Filter at the source. Drop debug-level logs in production in the collector, before ingest. Trace sampling, such as tail sampling, also reduces the volume sent.
- Define retention per stream rather than leaving the infinite default.
- Watch enrichment. Every field added by a pipeline increases the billed size.
- Treat cost as an internal SLI. An ingest budget per service, tied to your SLOs, avoids surprises.
If you compare with other platforms, keep the same method: volume, retention, billing unit. Our Dynatrace and Datadog comparison shows they do not bill the same units. For background, see also observability and monitoring, and our guide to data retention and storage on the Dynatrace side.
Frequently asked questions
Does Elastic Observability Serverless cost depend on the agent used?
No, according to Elastic’s billing page: the ingest architecture (Elastic Agent, Logstash, OpenTelemetry or other collectors) does not affect cost. Only the volume measured at the end of the pipeline counts.
Why does my bill exceed the size of my indices?
Because the billed volume is that of enriched, normalised data before Elasticsearch compression. It can therefore exceed the index size and the volumes seen by a cloud proxy.
What is the default retention?
With no setting, the documentation says effective retention is infinite and data is kept indefinitely. Set data_retention on each stream to bound the stock.
Conclusion
To size Elastic Observability Serverless cost, measure the raw enriched volume, multiply by the retention you want, then apply the rates read on the official page, with their date. Reduce ingest first, then bound retention stream by stream.
Sources
- Observability billing dimensions, Elastic documentation
- Serverless Observability pricing, Elastic (read on 30 October 2026)
- Data stream retention, Elastic documentation
- Put data stream lifecycle, Elasticsearch Serverless API
span.observer is an independent blog, not affiliated with Dynatrace LLC or Elastic N.V. Product names belong to their respective owners; rates are those displayed by the vendor on the date given, and stream names in the examples are fictitious.