Course: Dynatrace SaaS metrics · Module 1/7 — Grail metrics · Duration: ~40 min · Level: Beginner to intermediate
Objectives:
- Read a
dt.*metric key and know what it measures. - Understand the role of dimensions and of the DQL
timeseriescommand. - Map a classic
builtin:key to its Grail key. - Know the resolution, retention and permissions of metrics on Grail.
Prerequisites: a Dynatrace SaaS environment with at least one OneAgent, the Notebooks app and basic DQL.
Grail metrics are the time series that Dynatrace SaaS stores in Grail, alongside logs, spans and events. This first module of the Dynatrace SaaS metrics course sets out the vocabulary: dt.* keys, dimensions, aggregations, mapping from the older keys and how long data is kept.
For an SRE, a metric is the raw material of an SLI. Misread a key or a unit and your SLO measures something other than what you think, and the on-call rota pays for the difference. An hour spent understanding the model saves weeks of misleading dashboards.
This module applies to Dynatrace SaaS (the platform with Grail). Dynatrace Managed has neither Grail nor DQL: its metrics are handled with the metric selector, covered in the Dynatrace Managed metrics course.
What are Grail metrics?
A metric on Grail is a sequence of timestamped numeric measurements, identified by a key and described by dimensions. OneAgent produces the built-in metrics automatically; others arrive through OpenTelemetry, the ingest API or extraction from logs and spans (module 7).
The documentation sums up what Grail brings to metrics:
- 1-minute resolution kept for 15 months;
- enrichment with context (host, process, Kubernetes, cloud);
- no fixed cardinality limit, useful for highly dynamic Kubernetes deployments;
- the ability to build time series from logs, spans or other data.
Metrics consumption on Grail falls under the Dynatrace Platform Subscription (DPS) model. Check your contract before ingesting custom metrics at scale.
Anatomy of a dt.* key
Dynatrace-provided keys follow three naming rules, described on the “Built-in Metrics on Grail” page:
- the
builtin:prefix is replaced bydt., which marks a Dynatrace-provided metric; - snake case replaces camel case:
bytes_readrather thanbytesRead; - the name describes the measurement more precisely:
dt.host.disk.used.percentrather thanusedPct.
Read a key from left to right, from the general to the specific: dt.host.memory.avail.percent is a host’s available memory, as a percentage. Metrics you create yourself do not start with dt.: that prefix is reserved.
Mapping builtin: to dt.*
If you come from Dynatrace Managed or Metrics Classic, your queries, alerts and dashboards use builtin: keys. The documentation publishes the full mapping table. Here is a real excerpt:
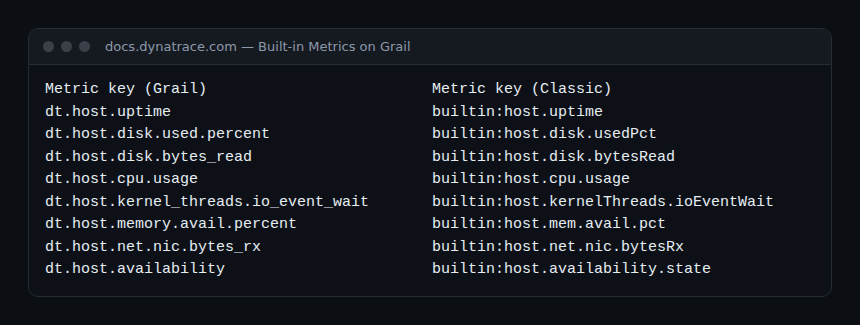
Three cases need attention during a migration:
- Missing pre-aggregated metrics.
builtin:host.net.bytesRxalready aggregated network interfaces per host. Grail handles high cardinality: you querydt.host.net.nic.bytes_rxdirectly and group by host. Likewise,builtin:host.mem.totalis not carried over. - Extensions 1.0.
builtin:tech.*metrics from Extensions 1.0 appear with thelegacy.prefix, for examplelegacy.cassandra.KeyCache.Hit.Rate. Exceptions: generic process metrics (builtin:tech.generic.*) and WebSphere. - Services. Some thirty classic service keys converge into three per-endpoint metrics, filtered by dimensions (module 3). Calculated service metrics move from the
calc:serviceprefix to theservice.prefix once enabled on Grail.
The guide to migrating from Managed to SaaS puts this mapping in the context of a full migration project.
Dimensions, aggregations and timeseries
A dimension is a key-value pair attached to each data point: dt.entity.host, dt.smartscape.host, endpoint.name, k8s.namespace.name… It is used to filter and split the series. The same metric key with different dimension values forms as many distinct series.
You read a metric with the DQL timeseries command, a starting command that loads, filters and aggregates in one step. It accepts the sum, avg, min, max, count, percentile, percentRank and countDistinct aggregations, and parameters such as by:, filter:, interval:, from: or rollup: (min, max, sum, avg, total).
The result is homogeneous: all series share the same timeframe and interval, and each cell holds an array of values, one per interval. Without interval:, Dynatrace picks a step suited to the timeframe, aligned on a well-known value (1, 2, 5, 10 minutes, 1 hour…). The language basics are in the DQL fundamentals module; module 5 of this course goes deeper into timeseries.
Exploring the available metrics
The metrics command lists existing series, without values or timestamps. It is for discovering keys and dimensions, over the last ten days at most and within a limit of 100,000 series per query. For metadata (description, dimensions), the documentation also points to the /dt/platform/metrics.metadata lookup file.
Hands-on exercise
Step 1 — List a host’s keys
In a notebook, get the identifier of a monitored host (HOST-… format) and run the documentation example:
metrics
| filter dt.entity.host == "HOST-6DF6DE092963F2AB"
| dedup metric.key
Expected result: a list of dt.host.*, dt.process.* and other keys sent by that host.
Step 2 — Chart a first series
timeseries usage = avg(dt.host.cpu.usage)The query returns a single series: the average CPU usage of all hosts. Display it as a line chart.
Step 3 — Split by dimension
timeseries usage = avg(dt.host.cpu.usage), by: {dt.smartscape.host}
| fieldsAdd host_name = getNodeName(dt.smartscape.host)
Expected result: one series per host, with its readable name. Compare the number of rows with the number of hosts in the environment.
Step 4 — Set the interval and timeframe
timeseries usage = avg(dt.host.cpu.usage), by: {dt.smartscape.host}, interval: 1h, from: -7dLook at the interval column: it is one hour, and each array holds about 168 values.
How to check it works
If timeseries returns an access error rather than an empty result, check your permissions: reading metrics requires storage:metrics:read and storage:buckets:read. An empty result on dt.host.cpu.usage usually means no OneAgent is sending data over the chosen timeframe: widen from: before looking further.
Best practices
- Check every key in the documentation table before putting it in an alert: a non-existent key raises no error, it simply returns an empty result.
- Write the unit next to the SLI:
dt.service.request.response_time, for example, is expressed in microseconds. - Split by as few dimensions as possible: each dimension multiplies the number of series to read and display.
- Keep
metricsfor exploration andtimeseriesfor charts and calculations.
Further reading
- Histogram metrics and OpenPipeline, for percentiles on your own metrics
- Dynatrace SaaS dashboard: DQL examples
- Official documentation: Built-in Metrics on Grail and DQL metric commands
← Course introduction · Course overview · Module 2: Grail host metrics →
Frequently asked questions
Do builtin: keys still work in Dynatrace SaaS?
They remain usable with Metrics Classic (Metrics API v2, Data Explorer). In DQL and on Grail, you must use the matching dt.* keys, hence the value of the mapping table.
How long are metrics kept on Grail?
The documentation states 1-minute resolution for 15 months. Retention rules specific to your account and buckets should still be checked in the environment settings.
Should I use dt.entity.host or dt.smartscape.host?
Both dimensions appear in the documentation. Recent examples use dt.smartscape.host with getNodeName(); the timeseries reference examples still use dt.entity.host. Pick one and stay consistent within a dashboard.
You can now read a dt.* key, find it from a builtin: key and chart it with timeseries. The next module applies these basics to host metrics, the most used ones on call.
span.observer is an independent community blog, not affiliated with Dynatrace LLC. This course does not replace the official Dynatrace University training and certifications. Check metric keys against the official documentation for your environment.