
Module 4 of the SLO / SLA training shows how to create a Managed SLO, that is a classic SLO in Dynatrace Managed, defined by a metric expression, an entity selector, an evaluation timeframe and thresholds, from the wizard or through the /api/v2/slo API.
Learning path: SLO SLA training · Module 4/6 · Duration: ~40 min · Level: Intermediate · Platform: Dynatrace Managed (classic SLOs, metric expressions, API v2)
Objectives:
- Create an SLO with the four-step wizard
- Write an availability and a performance metric expression
- Filter entities and choose the evaluation timeframe
- Create and read an SLO through the API, with the right token scope
Prerequisites: modules 1 and 2, a Managed environment and an API token with the slo.read and slo.write scopes.
Dynatrace Managed has neither Grail nor DQL: its SLOs are “classic” and rely on builtin: metrics and the metric selector. The principle is the one from module 1: an SLI as a percentage, a target, a period. Only the way you write the SLI changes.
This module applies to Dynatrace Managed. The Dynatrace SaaS equivalent, with the Service-Level Objectives app and DQL, is covered in module 3. For a broader tour of configuration and API, see also Dynatrace Managed SLO: configuration and API.
Create a Managed SLO with the wizard
Go to Service-Level Objectives, select Add new SLO and follow the four wizard steps: Select your indicators, Define a filter, Add success criteria, Evaluate.
Step 1: choose the indicator
The Managed documentation offers six preconfigured SLOs:
- Service-level availability: successful calls divided by all calls of the service;
- Service-method availability: the same calculation on key requests;
- Service performance: “good” minutes (latency under the threshold) divided by total minutes;
- User experience: share of SATISFIED users according to Apdex;
- Mobile crash-free users: share of mobile users without a crash;
- Synthetic availability: successful synthetic executions over the total.
Then enter the SLO name and a Metric name, for example checkout_availability. Dynatrace derives four metric keys from it: func:slo.checkout_availability (status), func:slo.errorBudget.checkout_availability, func:slo.normalizedErrorBudget.checkout_availability and func:slo.errorBudgetBurnRate.checkout_availability. Pick this name carefully: the documentation states that it cannot be changed after creation.
Step 2: filter and timeframe
The timeframe selector offers Presets or a Custom value. The entity selector follows the REST API syntax: management zone (name or ID), tags, entity name, ID or type, health state, or a combination. The Preview button checks the selector before you move on. Documentation example:
type("SERVICE"),entityName("My service")Putting a management zone in the entity selector attaches the SLO to that zone: only users with access to it can see it. An SLO without a zone is global and visible to everyone.
Step 3: success criteria
Fill in the target (Failure) and the warning (Warning). The warning must sit between the target and 100%: for a 99% target, choose 99.5% for example. Turn on Error budget burn rate and set the threshold between slow and fast burn.
Step 4: evaluate, then create
Evaluate computes the SLO with the values entered. With no error, Create saves it and it appears in the list. You can also go through Settings > Cloud Automation > Definition > Add new SLO.
Write the metric expression
The metric expression produces the SLI as a percentage. For service availability, the documentation gives:
(100)*(builtin:service.errors.server.successCount:splitBy())/(builtin:service.requestCount.server:splitBy())The argument-less :splitBy() merges all entities matched by the filter into a single series, so the SLO returns one value. The documentation lists the error “One resulting value is required, but the SLO definition delivers more than one” among known issues; it typically appears when this grouping is missing.
For a time-slice performance SLO, the documentation suggests an expression that counts “good” intervals:
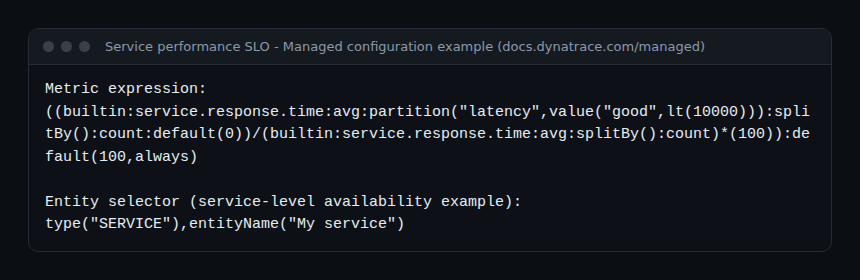
Critical lines: partition("latency",value("good",lt(10000))) classifies each point by latency; the documentation states that the required unit is the microsecond, so lt(10000) means under 10 ms. :default(0) replaces null values and :default(100,always) returns 100% when there is no data. For a 500 ms threshold, write lt(500000).
Create the SLO through the API
To version SLOs, use the environment’s POST /api/v2/slo endpoint. The token needs the slo.write scope. Here is the documentation’s body model, with the fields marked DEPRECATED removed (metricNumerator, metricDenominator, metricRate, useRateMetric):
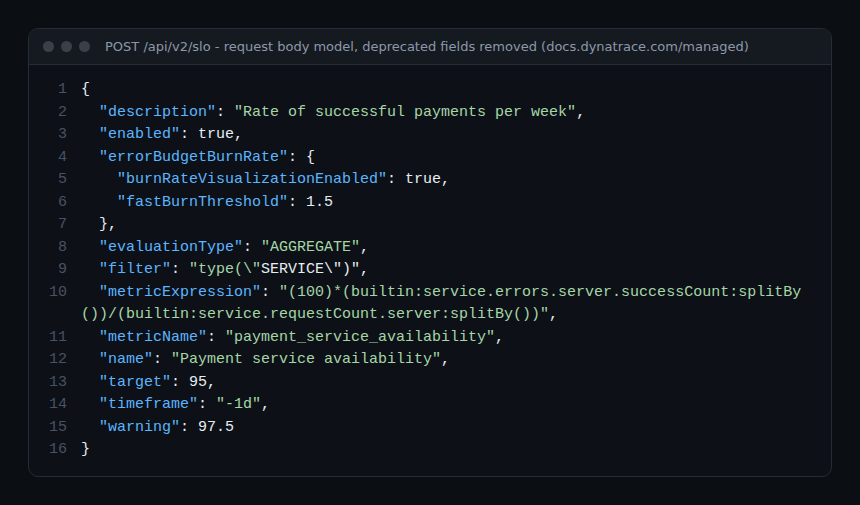
Things to know, all from the documentation:
name,target,warning,timeframeandevaluationType(only value:AGGREGATE) are required;enableddefaults tofalse: without it, the SLO is created disabled;filteruses the entity selector syntax and is limited to 1,000 characters;timeframeuses the global timeframe selector syntax; the model uses-1d, adapt it to your period;- the 201 response has no body: the new SLO ID is in the
Locationheader.
curl -s -i -X POST "https://{your-domain}/e/{your-environment-id}/api/v2/slo" \
  -H "Authorization: Api-Token $DT_TOKEN" \
  -H "Content-Type: application/json" \
  -d @slo.json
To manage SLOs as code over time, see Dynatrace SLOs with Terraform.
How to check that it works
- Read the evaluated SLO (scope
slo.read):curl -s "https://{your-domain}/e/{your-environment-id}/api/v2/slo?sloSelector=name(%22Payment%20service%20availability%22)&evaluate=true" \ -H "Authorization: Api-Token $DT_TOKEN" - Check the fields:
evaluatedPercentage(status; -1 on error, then read theerrorfield),errorBudget(positive means all is good),status(SUCCESS,WARNINGorFAILURE) anderrorBudgetBurnRate.burnRateValue, computed over the last hour. - With
evaluate=true, the page size is capped at 25. For a period other than the SLO’s own, addtimeFrame=GTFwithfromandto. - In the UI, open Actions > View in Data Explorer to chart the
func:slo.…key.
Reading example: target 95 and status 96.25 give errorBudget = 1.25. If the normalised budget is turned on (Settings > Cloud Automation > Setup), the documentation computes it as (96.25 − 95) ÷ (100 − 95) × 100 = 25% of the budget left.
Alert on the SLO
From the list, More (…) > Create alert offers two types: Status (the status drops below the target) and Burn rate. Alerts rely on metric events evaluated over the last hour: a threshold of 10 fires when the burn rate exceeds 10 over the past hour. The documentation notes that Davis does not alert on the target breach itself, but on the underlying metrics and entities. Alerting strategies are covered in SLO burn rate alerts and in module 5.
Hands-on exercise
- With the wizard, create a Service-level availability SLO on a staging service: target 99%, warning 99.5%, burn rate on.
- Create the same SLO through the API with another
metricName, remembering"enabled": true. - Expected result: both SLOs show the same
evaluatedPercentageinGET /api/v2/slo?evaluate=true.
Quiz
- Which scope do you need to create an SLO through the API? a)
metrics.readb)slo.readc)slo.writed)settings.read - In a performance SLO,
lt(10000)means: a) 10 s b) 10 ms c) 10 µs d) 10,000 requests - What happens if
enabledis omitted? a) 400 error b) SLO enabled c) SLO disabled d) SLO deleted
Answers
- c)
slo.write; reading needsslo.read. - b) The unit is the microsecond: 10,000 µs = 10 ms.
- c) The default value is
false.
Best practices
- Choose the
metricNamecarefully: it is fixed and used in every chart. - Always end the metric expression with a single grouping (
:splitBy()). - Attach team SLOs to a management zone; keep management-level SLOs global.
- Evaluate the SLO before creating it and compare with a manual calculation.
Frequently asked questions
Can I use DQL in a Managed SLO?
No. Dynatrace Managed has no Grail: the SLI is written as a metric expression. DQL is reserved for Dynatrace SaaS SLOs (module 3).
Are metricNumerator and metricDenominator still useful?
They are marked DEPRECATED in the API documentation. Use metricExpression, which covers the ratio as well as more complex expressions.
How do these SLOs compare with other tools?
The concepts are the same; only the way you write the SLI changes. A detailed comparison is in Dynatrace vs Grafana SLO.
You can now create a Managed SLO, from the wizard or through the API, and check it. The next module decides what to do when the budget melts: the error budget policy.
← Module 3: Dynatrace SaaS SLO · Course overview · Module 5: error budget policy →
span.observer is an independent community blog, not affiliated with Dynatrace LLC. The screens, fields and scopes quoted come from the official Dynatrace Managed documentation (Configure and monitor SLOs, POST an SLO); check them against your cluster version.