Elastic APM log correlation means writing the current trace identifier, the trace.id field, into every log line. During an incident you can then jump from a slow transaction to its logs, and from an error log to the full trace, without digging through timestamps. This tutorial follows three steps: enable correlation in the agent, inject the identifiers, and ingest the logs.
The walkthrough covers two cases, Node.js with Pino and .NET with Serilog. The information comes from the Elastic documentation, read on 30 October 2026; check package and field names against your stack version.
For an SRE team, the stake is mean time to resolution (MTTR): every manual hop between two tools lengthens the incident. This article is about Elastic, not Dynatrace Managed or Dynatrace SaaS; the last section says where Dynatrace stands.
In brief
- A log is correlated when it holds
trace.idand eithertransaction.idorspan.id. - The APM agent supplies the identifiers; an ECS (Elastic Common Schema) formatter writes them into the log.
- Logs must reach the same Elasticsearch as the APM data.
Elastic APM log correlation: the principle
According to the Elastic documentation on application logs, correlation lets you see a log’s context, all the logs of a trace, and move between logs and traces. An ECS log in JSON carries fields such as log.level, service.name, trace.id and transaction.id.
Keep the signals apart. A trace groups spans, which are timed operations. A log is a text event. Nothing links them except the identifier you add to the log. Hence the three steps below.
The documentation also lists three ways to ship logs. Filebeat or Elastic Agent collects plain text files, whatever the language. An ECS plugin writes ready-to-use JSON, at the cost of changing the logger configuration. Reformatting by the APM agent exists only for Ruby, Python and Java, and direct log sending by the agent only for Java: neither applies to our examples.
Step 1: enable correlation in the agent
For Node.js, the elastic-apm-node agent exposes apm.currentTraceIds. Per the API documentation, this property returns an object with trace.id and either transaction.id or span.id, depending on the active element; outside a transaction, the object is empty. It has been available since agent version 2.17.
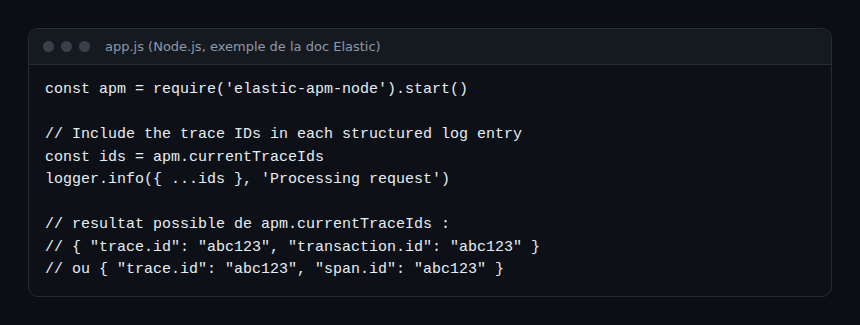
The agent must start before the rest of the application. With no active transaction there is no identifier: a log written at start-up or in a task outside a request will not be correlated.
For .NET, the agent documentation lists two supported logging frameworks: Serilog and NLog. For another logger, it points to a guide for injecting the identifiers manually.
Step 2: inject the identifiers into every log
Node.js with Pino
With an ECS formatting package for Pino, Winston or Morgan, the documentation says the agent calls the API for you and the identifiers are injected automatically. For Pino, the package is @elastic/ecs-pino-format. According to its page, it supports Pino 6, 7 and 8, and adds trace.id, transaction.id and span.id when the Node.js APM agent is active. The apmIntegration: false option turns this off.
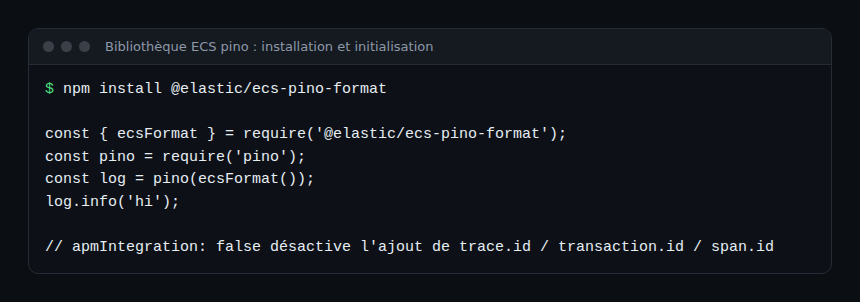
const apm = require('elastic-apm-node').start();   // first
const { ecsFormat } = require('@elastic/ecs-pino-format');
const pino = require('pino');

const log = pino(ecsFormat());
log.info('order received');
A limit noted on the same page: fields passed to child() are not converted, so a req object in a child logger gets no ECS HTTP fields. Without an ECS package, add ...apm.currentTraceIds to each entry yourself, as in the step 1 screenshot.
.NET with Serilog
The elastic/ecs-dotnet repository describes two packages. Elastic.Apm.SerilogEnricher adds trace and transaction identifiers to Serilog events created during a transaction. Elastic.CommonSchema.Serilog provides EcsTextFormatter, which writes events as ECS JSON; combined, the identifiers appear in the ECS output.
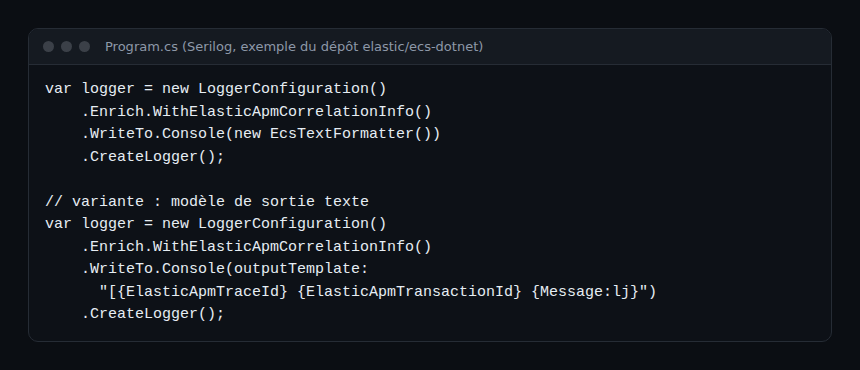
For NLog, the Elastic.Apm.NLog package provides the ${ElasticApmTraceId} and ${ElasticApmTransactionId} placeholders, and EcsLayout puts them in the ECS output. Outside a transaction, the placeholders stay empty.
Step 3: ingest the logs into Elasticsearch
ECS JSON logs are written to standard output or a file, then collected by Filebeat or Elastic Agent. The Node.js page asks you to send logs to the same Elasticsearch instance as the APM data. The .NET page confirms that Filebeat lets you ship logs, correlate traces and logs, and move from APM to log exploration.
The Filebeat setup details (files, Kubernetes, Docker) depend on your environment and are in the ECS library documentation; the Pino page notes that Filebeat is not available on Elastic Cloud Serverless. This article does not detail it, as we have not verified each case.
How to check that it works
- Send a request to the instrumented service, then read the raw log line: it must contain
trace.idandtransaction.id. - In Kibana, open the service in Observability, then its Logs tab. Per the documentation, you can jump from a correlated log to its trace, and the environment filter, query and time range are kept.
- In Log Events, search for a
trace.idtaken from a failed transaction, then choose Open logs in Discover to widen the query.
The Logs tab searches the indices set in the observability:logSources advanced setting; custom indices need extra configuration.
If the raw line has no identifier, work backwards: agent started too late, no enricher, or outside a transaction. If it has one but Kibana shows nothing, check ingestion and indices.
What about OpenTelemetry and Dynatrace?
The Elastic documentation also lists correlation guides for Elastic’s OpenTelemetry SDKs (Java, .NET, Node.js, PHP, Python); we did not open them one by one. The principle is the same: a log carries the trace and span identifiers of the active context. To understand each signal’s role, read observability versus monitoring; to route logs and traces with a Collector, see the Collector on Kubernetes.
To place Elastic against another vendor, see the Dynatrace and Datadog comparison, and to limit the volume of stored traces, tail sampling with OpenTelemetry. We claim no integration between Elastic APM and Dynatrace.
Best practices
- Start the agent before any other module, or some requests escape instrumentation.
- Log in ECS JSON rather than text to parse: the format is fixed at write time.
- Never put personal data or tokens in log messages.
- Test correlation in your delivery pipeline: a log without
trace.idon a critical path is a defect to fix.
Frequently asked questions
Which fields must a log hold to be correlated with a trace?
According to the Elastic documentation for Node.js, a trace.id and either a transaction.id or a span.id.
Why do some logs have no trace.id?
The identifier exists only during an active transaction or span; outside that context, apm.currentTraceIds returns an empty object. A log written at start-up or by a background task therefore has no identifier.
Do I need Filebeat to correlate?
You need a way to ingest logs into the same Elasticsearch as the APM data. The documentation cites Filebeat and Elastic Agent; direct sending by the agent is documented only for Java.
Conclusion
Three steps are enough: an active agent, a formatter that writes trace.id into every log, and ingestion into the right cluster. The payoff shows at the first outage: a slow trace leads to its logs in one click.
Sources
- Log correlation, Node.js agent, Elastic documentation
- Node.js Agent API, Elastic documentation
- Stream application logs, Elastic documentation
span.observer is an independent community blog, not affiliated with Dynatrace LLC or Elastic N.V. Product names belong to their respective owners; values come from the Elastic documentation, so check them for your version.