Module 2 of the SLO and SLA training path: error budget calculation from percentage to minutes and requests, choosing the window, and the burn rate that tells you how fast the budget melts.
Path: SLO and SLA training · Module 2/6 · Duration: ~40 min · Level: Beginner to intermediate
Objectives:
- Convert an SLO target into minutes of downtime and a number of failed requests
- Choose between a rolling and a calendar window
- Tell an event-based SLO from a time-based one
- Calculate a burn rate and know what it means
Prerequisites: module 1 (SLI, SLO, SLA) and a spreadsheet or Python for the exercise.
“99.9% is almost 100%”: the sentence reassures until the first 45-minute incident, which on its own breaches the month’s SLO. A percentage means nothing to anyone on call. Minutes and requests do.
This module does the maths by hand, step by step, so you can check what any tool displays. The formulas are product-agnostic; they apply to SLOs in Dynatrace SaaS as well as Dynatrace Managed.
Error budget calculation: from percentage to minutes
The formula fits on one line:
budget = (100% − target) × window lengthFor a 99.9% SLO over 30 days:
30 d × 24 h × 60 min = 43,200 min
43,200 min × 0.1% = 43.2 min = 43 min 12 s
The small script below applies the same formula to common targets and three windows. Its real output:
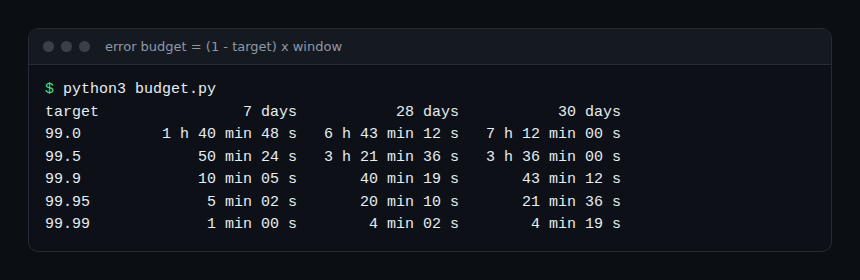
Three useful readings:
- going from 99.9% to 99.99% divides the budget by ten: 4 min 19 s per month, less than the time needed to detect an incident and start a rollback;
- over 7 days, a 99.9% SLO tolerates only about 10 minutes: one failed deployment is enough;
- a 28-day window always contains 4 full weeks, so the same number of weekends: period-over-period comparisons stay fair.
From percentage to requests
For an event-based SLO, the budget is counted in requests. If the API receives 2 million requests over 30 days with a 99.9% target:
2,000,000 × 0.1% = 2,000 failed requests allowedThe remaining budget follows: after 500 failures, (2,000 − 500) / 2,000 = 75% of the budget remains. Note that total volume is only known at the end of the window: tools work on observed volume, and the budget in requests moves with traffic.
Rolling or calendar window
| Rolling (last 30 days) | Calendar (calendar month) | |
|---|---|---|
| How it works | Every day the oldest day drops out and the newest comes in | The counter resets on the 1st of the month |
| Strength | Reflects users’ recent experience, no reset effect | Matches the billing cycle and contracts |
| Weakness | An incident weighs for 30 days, even after the fix | On the 30th a full budget means little; on the 2nd one incident empties it for the whole month |
| Typical use | Internal SLO, steering the team | SLA, customer reporting |
The most common combination: internal SLO over a rolling 28 or 30 days, SLA over the calendar month. Module 6 comes back to this choice from the contract side.
Event-based or time-based SLO
Event-based (request-based): SLI = good requests / valid requests. An outage at night, with little traffic, burns little budget; the same outage at peak time burns a lot. That is what users experience.
Time-based (or windows-based): the window is cut into slices, for example one minute, and each minute is “good” if it meets a threshold (say, success rate ≥ 99% over the minute). SLI = good minutes / total minutes. The result maps directly to minutes of downtime, which makes it readable in a contract, but a minute with no traffic counts as much as a peak minute.
Example on the same day: 10 minutes of total outage at 3 a.m. (1% of daily traffic) cost 10 minutes of budget in time mode, but only 1% of the day’s requests in event mode.
Burn rate: the consumption speed
The burn rate compares the observed error rate with the error rate the SLO allows:
burn rate = observed error rate / (100% − target)- burn rate = 1: the budget runs out exactly at the end of the window;
- burn rate = 2: it runs out halfway, in 15 days out of 30;
- burn rate < 1: some budget will be left.
Full calculation: 99.9% SLO, SLI measured over the last hour at 98.56%.
observed error rate = 100 − 98.56 = 1.44%
allowed rate        = 100 − 99.9  = 0.1%
burn rate           = 1.44 / 0.1  = 14.4
At this pace, one hour consumes 14.4 × 1 h / 720 h = 2% of the 30-day budget, and the whole budget goes in 720 / 14.4 = 50 hours. That is the fast-alert threshold suggested by the Google SRE Workbook; the burn rate alerting guide and module 5 build multi-window alerts from it.
Dynatrace SaaS uses the same formula. The documentation of the Service-Level Objectives app shows how to add it to an SLI DQL query:
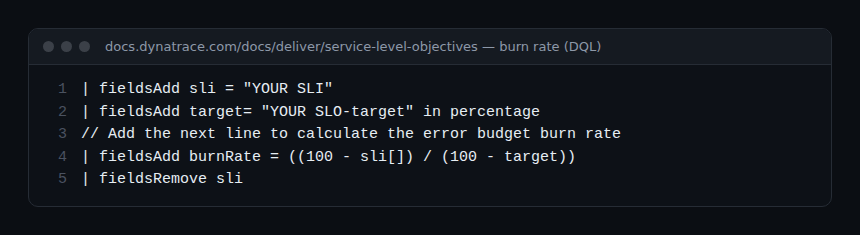
It reads burnRate = ((100 - sli[]) / (100 - target)), exactly the calculation above, with SLI and target in percent. In Dynatrace Managed, the classic SLO overview page shows the status, target, warning threshold, remaining error budget and timeframe of each SLO; module 4 details that configuration.
Best practices
- Always show the budget in minutes or requests next to the percentage.
- Prefer a 28-day window to compare equivalent periods.
- Use event-based SLOs to steer the team, time-based ones if the contract requires it.
- Alert on burn rate, never on a single dip in the SLI.
Hands-on exercise
Step 1 — Convert to minutes
Calculate the 30-day budget of your two SLOs from module 1. Expected result: for 99.5%, 3 h 36 min.
Step 2 — Convert to requests
Multiply the real monthly request volume by (100% − target). Expected result: a number of allowed failures to display on the team dashboard.
Step 3 — Calculate a burn rate
Take the error rate of the last hour and divide it by the allowed rate. Expected result: a value close to 0 in normal times, well above 1 during an incident.
Step 4 — Replay an incident
Take the last incident: duration, error rate, share of budget consumed. Expected result: the percentage of the monthly budget it cost.
Quiz
- Budget of a 99.9% SLO over 30 days? a) 4 min 19 s b) 43 min 12 s c) 7 h 12 min
- A burn rate of 2 over a 30-day window exhausts the budget in: a) 2 days b) 15 days c) 60 days
- Which SLO penalises a 3 a.m. outage less? a) Time-based b) Event-based
- Which window best suits an SLA billed monthly? a) Rolling b) Calendar
Answers
- b) 43,200 min × 0.001 = 43.2 min.
- b) 30 / 2 = 15 days.
- b) Few requests fail when traffic is low.
- b) It follows the billing cycle.
Going further
- Burn rate alerts on Dynatrace SLOs
- The error budget as a release gate
- SLOs on OpenTelemetry data with DQL
- Dynatrace documentation — Service-Level Objectives
- Google SRE Workbook — Alerting on SLOs
← Module 1: SLI vs SLO vs SLA · Path overview · Module 3: SLOs in Dynatrace SaaS →
Frequently asked questions
Why does my tool not show exactly 43 min 12 s?
For an event-based SLO, the tool expresses the budget as a share of requests, not minutes. Minutes are exact only for a time-based SLO; otherwise they are an order of magnitude.
Does unused budget carry over to the next month?
No. With a calendar window it resets; with a rolling window, old days simply drop out of the calculation.
Should a high burn rate for five minutes page the on-call engineer?
Not necessarily. A window that is too short produces false positives. Module 5 combines a long and a short window to alert only on sustained consumption.
You can now convert a target into minutes and requests, choose a window and calculate a burn rate. The next module moves to practice in Dynatrace SaaS.
span.observer is an independent community blog, not affiliated with Dynatrace LLC. This path does not replace the official Dynatrace University training. Check features against the official documentation for your version.