Graphify knowledge graph: the Graphify-Labs/graphify repository turns a project (code, documents, PDFs, images, video) into a graph you query instead of grepping through files. You call it with the /graphify command from a coding assistant. It showed around 132,100 stars in October 2026, with dual Apache-2.0 and MIT licensing.
For an engineer or SRE taking over unfamiliar code (an undocumented service, a monorepo, an incident repository), the idea is to see which components depend on what without reading a hundred files. This article presents what the repository says, the installation according to the README, what the tool produces, and the points to watch: privacy, the query log, and the commercial offering next to it.
The information comes from the README and the project’s documentation. span.observer has not installed Graphify: the screenshot and the command output below come from the repository’s README (an example on the FastAPI code).
Graphify knowledge graph: what the repository says
- Who: Graphify Labs, which presents itself as the owner of the name and logo. The README shows a Y Combinator S26 badge. The
LICENSE-MITfile reads “Copyright (c) 2026 Safi Shamsi”. - Licence: the repository contains a
LICENSEfile (Apache-2.0, matching the README badge) and aLICENSE-MITfile. The README does not say which part falls under which: read both files before any commercial use. - Version: the
graphifyyPyPI package was at 0.9.93, published on 20 October 2026. The repository’s default branch isv8. - Inputs: about 40 programming languages parsed with tree-sitter; documents, PDFs, images, audio and video through a semantic pass; SQL schemas and configuration files with optional extras.
- Outputs: a
graphify-out/folder withgraph.html(interactive graph),GRAPH_REPORT.md(central concepts, surprising links, suggested questions) andgraph.json(the full graph, queryable afterwards). - Principle: every link is tagged
EXTRACTED(explicit in the source) orINFERRED(derived). The README stresses that it is not a vector index: no embeddings, a real graph you traverse.
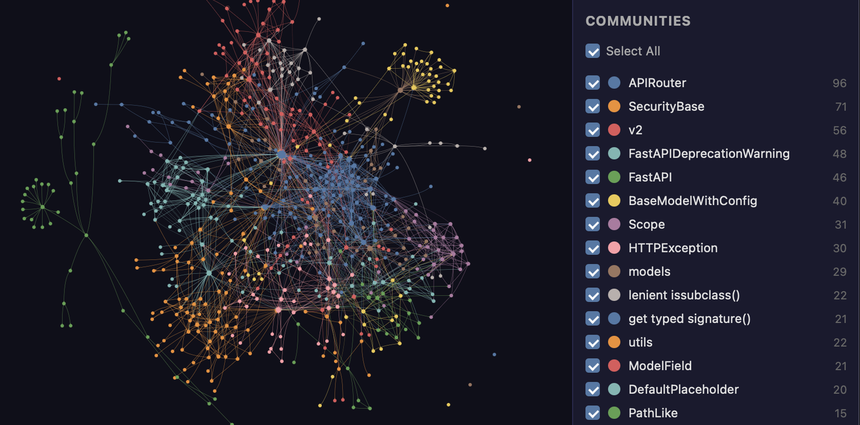
The screenshot shows the graph.html produced on the FastAPI code: each colour is a detected community, that is, a subsystem of the code.
Installing Graphify from the README
Step 1: Prerequisites
Python 3.10 or newer, and uv (recommended) or pipx. The README gives installation commands for macOS (brew install [email protected] uv), Windows (winget install astral-sh.uv) and Debian or Ubuntu.
Step 2: Install the command and register it in your assistant
uv tool install graphifyy      # or: pipx install graphifyy
graphify install               # detects your assistant and registers the skill
Mind the name: the official PyPI package is spelled graphifyy with two “y”. The README warns that other graphify* packages are not affiliated. The command itself remains graphify.
Step 3: Build the graph
In your coding assistant (Claude Code, Cursor, Gemini CLI, GitHub Copilot and some twenty others, according to the README), type:
/graphify .With Codex the syntax is $graphify. To install the skill in the current repository rather than your user profile: graphify install --project. To rebuild automatically on each commit: graphify hook install.
Querying the graph
Once the graph is built, the README describes three gestures: graphify query "question", graphify path A B and graphify explain "Name". Here is the sample output the project publishes on the FastAPI code:
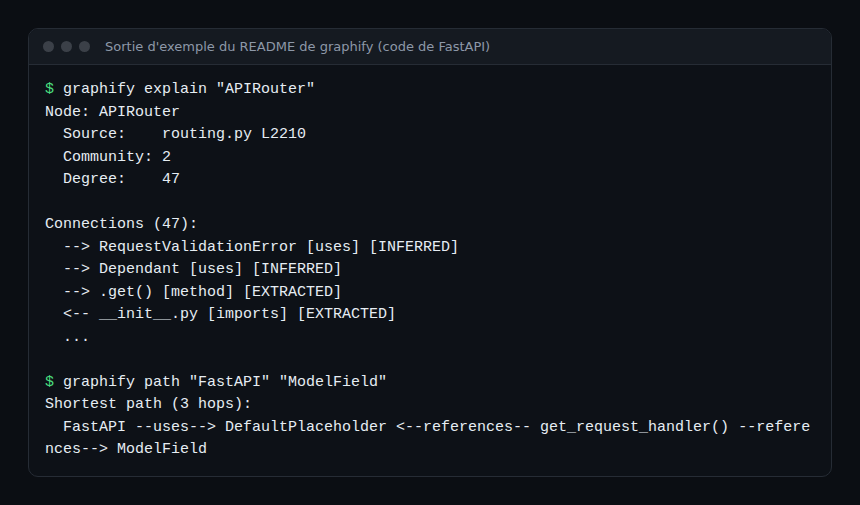
The value for operations is visible here: explain gives the source file, community and degree of a component; path shows the shortest path between two components. INFERRED tags are hypotheses: check them in the code before drawing conclusions.
Privacy and observability of the tool
- Code: parsed locally by tree-sitter, with no language model, according to the README; a code-only corpus builds without an API key.
- Documents, PDFs, images: sent to your assistant or a configured provider (environment variables for Gemini, Claude, OpenAI, Ollama, Bedrock and others).
GRAPHIFY_BACKEND=nonedisables the models,GRAPHIFY_BACKEND=ollamakeeps everything local. - Telemetry: the README states there is none.
- Query log: enabled by default, every
query,path,explainand MCPquery_graphcall is appended to~/.cache/graphify-queries.login JSON Lines format (timestamp, question, corpus, node count, duration). Full responses are not stored. To opt out:GRAPHIFY_QUERY_LOG_DISABLE=1.
For a local tool, this log is the only documented usage trace: it lets you see how long each query took. The README also mentions an mcp extra (uv tool install "graphifyy[mcp]") that serves the graph through an MCP stdio server; for that kind of server, see observing MCP agents with OpenTelemetry. I found no documented OpenTelemetry export.
How to check that it works
- After
/graphify ., thegraphify-out/folder containsgraph.html,GRAPH_REPORT.mdandgraph.json. - Open
graph.html: do the communities match the subsystems you know? - Run
graphify explainon a component you know and compare theEXTRACTEDlinks with the code.
Limits and open points
- The project’s figures: the README publishes results (LOCOMO, LongMemEval-S, ERPNext) and states that they come from the project itself; they are not reproduced here. The headline about cutting agent token spend by 80% concerns the cloud offering and remains a commercial claim.
- Cloud offering: “Graphify Cloud”, a paid product, is promoted throughout the README. The local tool is usable on its own, but read the page before depending on a feature.
- Optional dependencies: some options need a C compiler or a specific Python version; Codex needs
multi_agent = truefor parallel extraction. - Youth: over 130,000 stars, frequent releases and a version number below 1.0: expect changes.
Best practices
- Start with a non-sensitive repository, using
--code-onlyif you do not want anything sent to a model. - Exclude secrets and personal data from the corpus before the semantic pass.
- Re-read
INFERREDlinks before quoting them in a review. - Decide how long to keep
~/.cache/graphify-queries.log, which contains your questions. - Combine it with agent memory or context compression: see context-mode and the agents’ context window.
Frequently asked questions
Does Graphify send my code to a service?
According to the README, code is parsed locally. Only documents, PDFs and images go through your assistant or the provider you configure.
How does it differ from vector search?
The project says it uses neither embeddings nor a vector store: it builds a graph of relations that you traverse (query, path, explain).
Does Graphify work with the GitHub MCP server?
They are two separate tools: one maps a project, the other exposes the GitHub API to an agent. See the official GitHub MCP server.
Conclusion
Graphify offers a concrete way to understand unfamiliar code: a local graph, explicit links and three query commands. Try it on a non-sensitive repository, read both licence files, switch the log off if needed, and treat the README’s figures as the project’s own claims.
span.observer is an independent community blog, not affiliated with Dynatrace LLC or the projects mentioned. Trademarks belong to their owners. Tools change quickly: check commands and options in their official documentation (docs.graphify.com).