Headroom LLM context compression is what the project promises coding agents: a layer that compresses everything an agent reads (tool outputs, logs, RAG chunks, files, history) before it reaches the model. The headroomlabs-ai/headroom repository shows around 77,500 stars at the end of October 2026, under the Apache-2.0 licence.
Fewer input tokens means lower cost and fewer compactions, but only if compression does not destroy useful information. This article summarises what the project does according to its README, shows its dashboard, walks through installation, then explains how to measure the savings yourself with its Prometheus and OpenTelemetry metrics. A note on honesty: span.observer has not installed Headroom; the commands come from the README and the project’s documentation, and the screenshots come from the repository.
Headroom LLM context compression: what the repository says
- Who: the
headroomlabs-aiorganisation; the documentation is hosted at docs.headroomlabs.ai. - Licence: Apache-2.0 (the repository’s LICENSE file).
- Figures read on 22 October 2026: about 77,500 stars, about 6,000 forks, 3,324 commits; the
pyproject.tomlon the main branch shows version 0.41.0 of theheadroom-aipackage, which requires Python 3.10 or newer. - Four ways to use it, per the README: a library (
compress(messages)in Python or TypeScript), a proxy (headroom proxy --port 8787), an agent wrapper (headroom wrap claude,codex,cursor,aider,opencode…) and an MCP server.
The described mechanism: a content router detects the data type and picks a compressor (JSON, code through its syntax tree, text with a model published on Hugging Face). Originals are kept locally (“CCR”) and the model can ask for them back with the headroom_retrieve tool. The project states that compression runs on your machine, without sending the content elsewhere to be compressed. This idea is close to context-mode, which keeps raw output out of the context with a different mechanism and a different licence.
Dashboard tour
The headroom dashboard command opens a dashboard while the proxy is running. The screenshot below comes from the repository: it shows health status, completed, failed or rate-limited requests, tokens saved, cost, the overhead added by the proxy (in milliseconds), what was removed by type (“JSON Bloat”, “Repetition”) and the impact on the provider’s prefix cache.
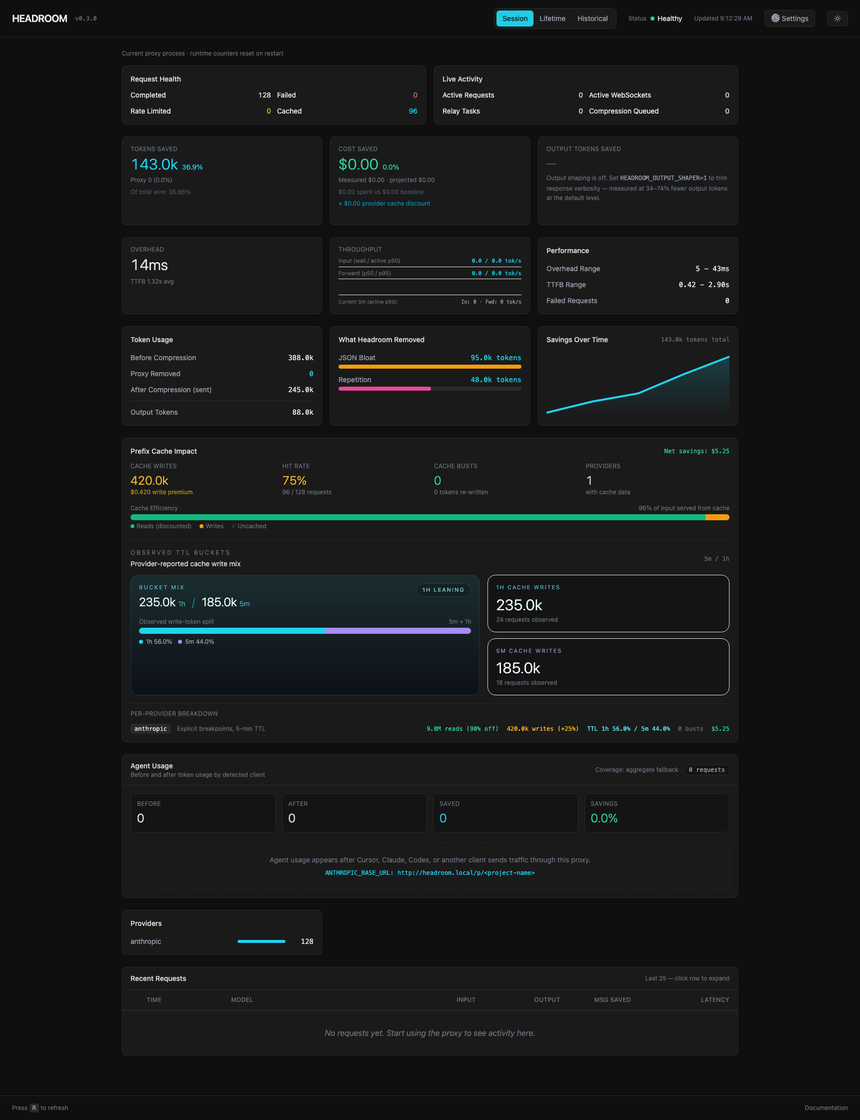
These are the project’s example values, not span.observer measurements. The dashboard also provides an estimated output-token saving when output shaping is enabled (HEADROOM_OUTPUT_SHAPER=1, off by default).
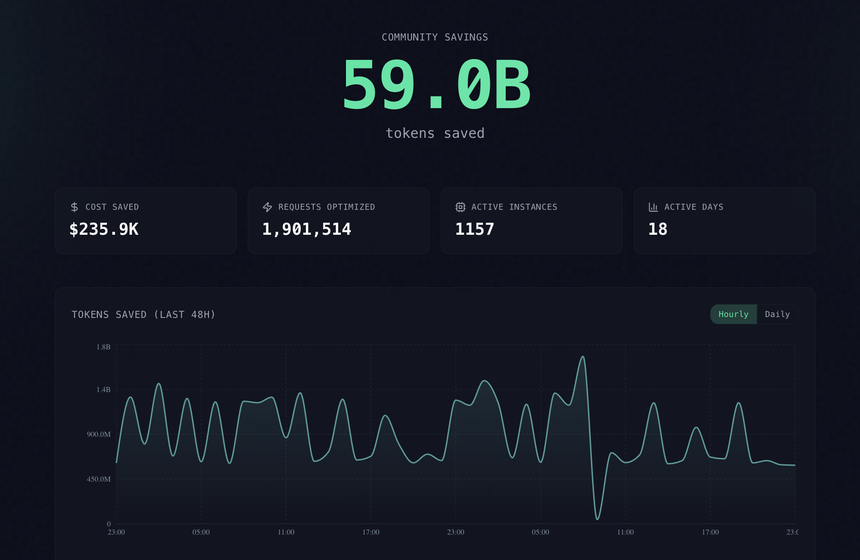
The repository’s second image shows an aggregated “Community savings” counter. In the passage consulted, the README does not detail how that figure is collected: take it as a project-supplied, unverified figure, and read the Limits section on the telemetry beacon.
Installation step by step
Step 1 — Install the CLI
The README gives, as options:
uv tool install --python 3.13 "headroom-ai[all]"
pip install "headroom-ai[all]"
npm install headroom-ai     # TypeScript SDK only, no CLI
A Docker image is also listed (ghcr.io/headroomlabs-ai/headroom:latest). To keep the footprint small, the README lists granular extras ([proxy], [mcp], [ml], [otel]…).
Step 2 — Pick a mode
headroom wrap claude          # wrap a coding agent
headroom proxy --port 8787    # drop-in proxy, no code change
headroom mcp install          # MCP server (headroom_compress, headroom_retrieve, headroom_stats)
The README states that headroom wrap starts a local proxy, installs the Serena server for code navigation and launches the agent configured to route through Headroom; headroom unwrap undoes it. Read that part before using it: it changes your agent’s configuration.
Step 3 — Check
headroom doctor      # health check
headroom perf        # performance
headroom dashboard   # live savings (proxy running)
Limits and open points
- The figures are the project’s own: the README publishes a table of four scenarios (21% to 57% saved) measured with the provider’s tokenizer, reproducible with
benchmarks/index_proof_table.py --seed 20260902. It says itself that gains depend on how repetitive the data is, and that prose or already dense output compresses very little. - Accuracy: the README’s accuracy tests show, at N=100, a ±0.03 delta that it considers within the confidence interval. Nothing replaces a trial on your own tasks.
- Telemetry beacon: the “Limitations” page of the documentation explains that
HEADROOM_BEACONis on by default (it can be disabled) and uploads an anonymous summary (counters, ratios, provider and model identifiers, operating system and architecture), never prompts or code. Turn it off withHEADROOM_BEACON=off,HEADROOM_TELEMETRY=offorDO_NOT_TRACK=1. Record this in your security review. - A proxy in the request path: it sees your provider keys and prompts. Keep it on loopback and treat it as a critical component, like an MCP server (see securing an MCP server).
How to measure savings and supervise the proxy
Headroom exposes several sources, per its “Metrics & Monitoring” page: the /stats endpoint (JSON), the /stats-history history (with CSV export), Prometheus metrics at /metrics (for example headroom_tokens_saved_total, headroom_requests_failed_total) and an OpenTelemetry export. The documentation warns that headroom_requests_total counts only completed requests, and that there are no histogram buckets: you compute averages from the _sum and _count pairs.
For OTLP export, install the [proxy,otel] extra and set these variables, taken from the documentation:
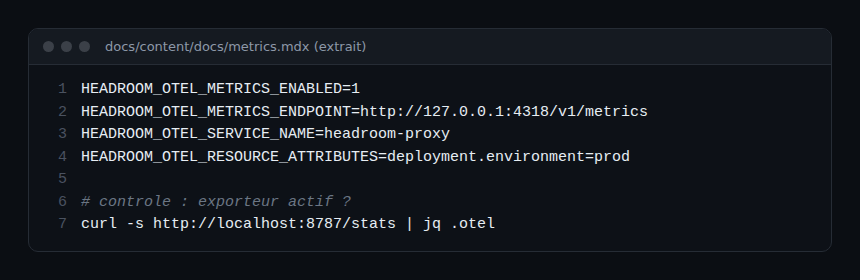
The documentation names the counters headroom.proxy.requests, headroom.proxy.tokens.input, headroom.proxy.tokens.output and headroom.proxy.tokens.saved, and specifies that the endpoint must be the full URL, with no automatic /v1/metrics suffix. For Dynatrace SaaS, Headroom’s page calls for a token with the metrics.ingest scope and OTEL_EXPORTER_OTLP_METRICS_TEMPORALITY_PREFERENCE=DELTA: Dynatrace’s OpenTelemetry documentation confirms that the backend only ingests delta-temporality values. The OTLP walkthrough is in supervising a coding agent in the enterprise. On Dynatrace Managed, first check that OTLP ingest is available on your version.
For an independent figure, compare the tokens billed on the agent side with and without Headroom, as in the token cost of an AI agent with OpenTelemetry, adding up all token types, cache included.
How to check that it works
headroom doctorconfirms that routing works.curl http://localhost:8787/healthanswers (a command from the documentation’s troubleshooting page).curl -s http://localhost:8787/stats | jq .otelconfirms the OTLP exporter is live.
Best practices
- Try a reference task rich in bulky output, three to five times with and without the proxy.
- Check answer quality, not just tokens: overly aggressive compression can hide a useful line.
- Pin the version and re-read the telemetry variables at each update.
- Keep the proxy reachable locally only; do not expose its port.
Frequently asked questions
Is Headroom open source?
Yes, the repository is under the Apache-2.0 licence. Still check the extras and models you install, each having its own licence.
Does Headroom send my prompts anywhere?
According to the README, compression runs locally. The proxy of course forwards the compressed request to your LLM provider, and the anonymous telemetry beacon, on by default, is described on the “Limitations” page.
What saving should I expect?
The project publishes 21% to 57% across four scenarios and warns that repetitive content gains most. Measure on your own workloads.
Conclusion
Headroom applies LLM context compression right at the proxy and gives you the means to measure it, with Prometheus and OpenTelemetry. Its figures are its authors’ own: confirm them on your tasks. Sources: headroomlabs-ai/headroom repository and Headroom documentation.
span.observer is an independent community blog, not affiliated with Dynatrace LLC or the projects mentioned. Trademarks belong to their owners. Tools change quickly: check commands and options in their official documentation.