KEDA Kubernetes autoscaling: the kedacore/keda repository describes KEDA as an event-driven autoscaling component that changes the replica count of any container in a Kubernetes cluster, including to and from zero. The repository page shows about 10,700 stars and about 1,600 forks at the end of October 2026 (figures rounded by GitHub), under the Apache 2.0 licence.
For an SRE the appeal is simple: instead of following CPU, you follow what really measures load, such as a message queue or a Prometheus query. The drawback is just as clear: one more component decides how many pods run, so you need to observe it. This article follows the README and the official keda.sh documentation (version 2.21), and does not claim to have installed KEDA.
A note on honesty: span.observer has not tested KEDA. The commands come from the documentation, and the screenshots come from keda.sh or reproduce extracts of its documentation word for word.
KEDA Kubernetes autoscaling: what the repository says
- Project: the README states that KEDA is a graduated project of the Cloud Native Computing Foundation (CNCF).
- Licence: Apache 2.0, checked in the repository’s LICENSE file on 26 October 2026.
- Principle: according to the README, KEDA provides fine-grained autoscaling, including to and from zero, for event-driven Kubernetes workloads. You configure it with a custom resource definition (CRD).
- Compatibility: the documentation says KEDA 2.21 is tested with Kubernetes 1.34 to 1.36.
- Figures: stars and forks were read on the repository page and are rounded. The page showed no readable release, so no release number is quoted.
A tour of the architecture diagram
The diagram on the “Concepts” page of keda.sh shows the three components and their roles. It comes from the project’s own site, whose documentation repository is under the Apache 2.0 licence.
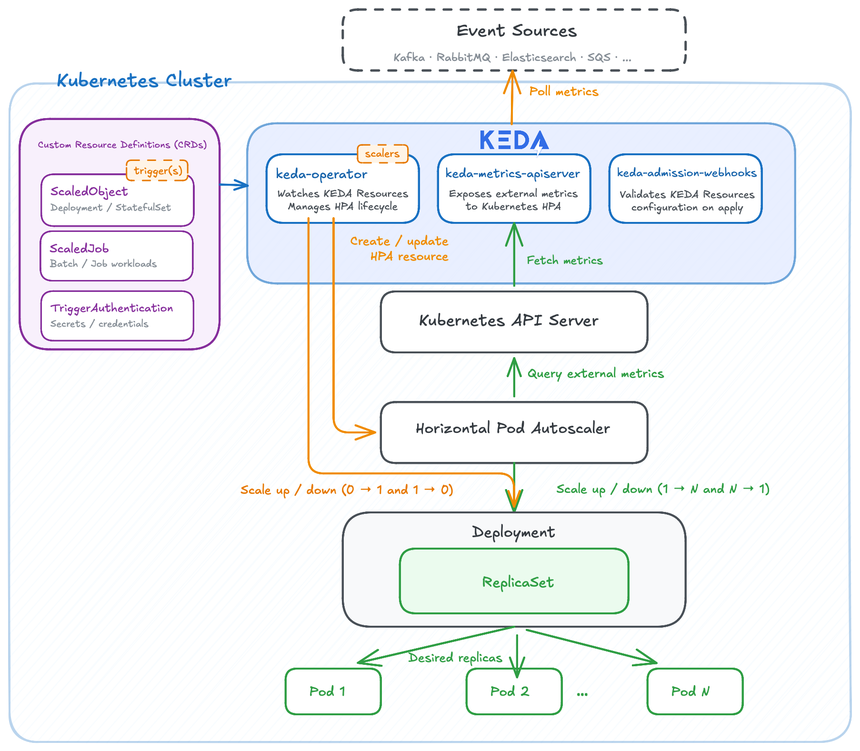
The documentation describes three components:
keda-operatorwatches the KEDA resources (ScaledObject, ScaledJob, TriggerAuthentication), manages the HPA lifecycle and moves a workload from 0 to 1 replica and back;keda-metrics-apiserverexposes external metrics to the Kubernetes API Server, which the HPA queries;keda-admission-webhooksvalidate resources when they are applied, for example to reject two ScaledObjects on the same Deployment.
So KEDA extends the Horizontal Pod Autoscaler (HPA) rather than replacing it. The 1-to-N transitions go through the HPA. One point to remember: the documentation states that scaling to zero is not supported with CPU or memory triggers.
Step-by-step installation
Step 1: Prerequisites
You need a Kubernetes cluster within the tested range, Helm installed and permission to install charts. The README also mentions Operator Hub and YAML files; what follows uses the Helm route from the documentation.
Step 2: Install with Helm
helm repo add kedacore https://kedacore.github.io/charts
helm repo update
helm install keda kedacore/keda --namespace keda --create-namespace
Step 3: Check the pods
kubectl get pods -n kedaYou should see the pods of the components described above. Uninstall with helm uninstall keda --namespace keda; the deployment page prints the option with an en dash, which you must replace with two plain hyphens.
Step 4: Declare a ScaledObject
A ScaledObject links a workload to one or more triggers. The example below is the one on the Prometheus scaler page of the documentation.
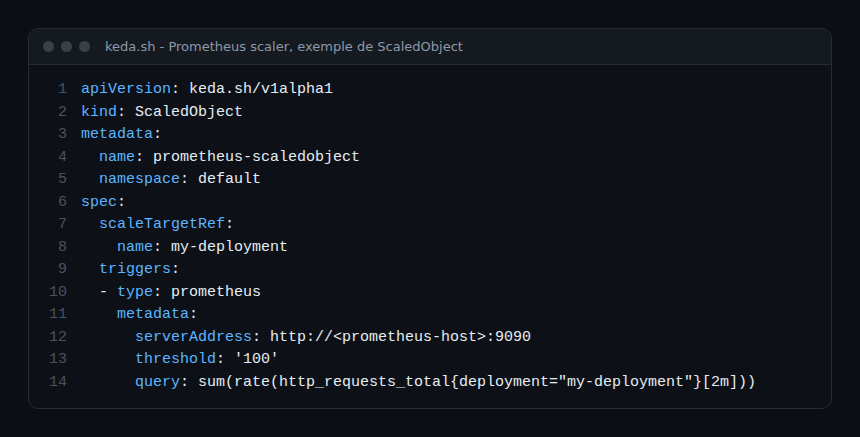
The specification page gives these defaults: pollingInterval 30 seconds, cooldownPeriod 300 seconds, minReplicaCount 0 and maxReplicaCount 100. The Prometheus scaler’s activationThreshold defaults to 0. The fallback field requires failureThreshold and replicas: it sets a replica count if the scaler fails repeatedly.
Observing KEDA: Prometheus metrics
To know whether autoscaling behaves as expected, the documentation says the operator, the admission webhooks and the metrics server expose Prometheus metrics on port 8080 at the /metrics path. To connect these metrics to your stack, see Prometheus and Dynatrace on Kubernetes.
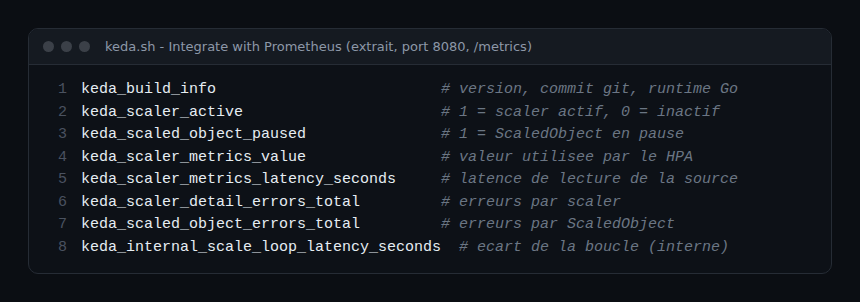
The screenshot reuses the names from the documentation; the comments are span.observer’s. A few useful readings:
keda_scaler_activeis 1 when the scaler is active and 0 otherwise: it is the “KEDA sees load” signal.keda_scaler_metrics_valuegives the value the HPA uses to compute its target.keda_scaler_metrics_latency_secondsmeasures the time taken to read the source; drift lengthens the scaling loop.keda_scaler_detail_errors_total,keda_scaled_object_errors_totalandkeda_scaled_job_errors_totalcount errors per scaler, ScaledObject and ScaledJob.keda_scaler_empty_upstream_responses_totalcounts empty responses from the source, for example a Prometheus query with no result.keda_scaled_object_pausedis 1 when a ScaledObject is paused.
The documentation notes that an operator with no scalers exposes only keda_build_info; the others appear with your scalers. High-cardinality labels (namespace, scaled_resource, trigger_name, metric_name) are enabled with --enable-high-cardinality-metrics-labels=true on the keda-operator Deployment: measure the storage cost first.
OpenTelemetry and Kubernetes events
On the OpenTelemetry side, the documentation describes an experimental integration, available since version 2.12. These are metrics pushed to a Collector, not traces. You enable the export with the operator argument --enable-opentelemetry-metrics=true and point to the Collector with the OTEL_EXPORTER_OTLP_ENDPOINT environment variable (the page’s example is http://opentelemetry-collector.default.svc.cluster.local:4318). OTEL_EXPORTER_OTLP_PROTOCOL selects HTTP or gRPC. Names take a different form, for example keda.scaler.active. See also the OpenTelemetry Collector on Kubernetes and OpenTelemetry and Prometheus.
KEDA also emits Kubernetes events, listed in its reference. The most useful in operations:
KEDAScaleTargetActivatedandKEDAScaleTargetDeactivated(Normal): the target goes to 1 or to 0;KEDAScaleTargetActivationFailedandKEDAScaleTargetDeactivationFailed(Warning): the change failed;KEDAScalerFailed(Warning): a scaler cannot create or check its event source;ScaledObjectCheckFailed(Warning): validation of a ScaledObject fails;ScaledObjectFallbackActivated: the fallback is active;ScaledObjectPausedandScaledObjectUnpaused: paused or resumed.
To inspect what the HPA receives, the metrics server documentation gives kubectl get --raw "/apis/external.metrics.k8s.io/v1beta1". To pause a ScaledObject it uses the annotation autoscaling.keda.sh/paused: "true", which freezes the current instance count. Alerts on these signals sit close to Kubernetes alerts on nodes, pods and quotas.
Limits and open points
- No scale to zero with CPU and memory triggers, according to the documentation.
- The OpenTelemetry integration is marked experimental; the page also lists deprecated metrics. Check the names for your version.
- The GitHub page showed rounded star counts and no readable release when read: check the releases before pinning a version.
- A scaler that loses its source can decide in surprising ways: set
fallbackand watch the errors. - KEDA does not replace sizing resource requests: see effective CPU requests of pods.
Best practices
- Alert on
keda_scaler_detail_errors_totalandkeda_scaler_metrics_latency_secondsbefore the load, not after. - Keep high-cardinality labels off until you need them.
- Define
fallbackfor critical workloads and test pausing in pre-production. - Tie the replica count to an SLO: autoscaling serves the error budget, not the other way round.
Frequently asked questions
Does KEDA replace the Horizontal Pod Autoscaler?
No. According to the documentation, it extends it: the operator creates and manages the HPA, which reads the external metrics KEDA provides.
Which metrics does KEDA expose?
Prometheus metrics on port 8080 at /metrics, for the operator, the webhooks and the metrics server. An experimental OpenTelemetry export also exists.
Can it scale down to zero replicas?
Yes, with event-driven triggers. The documentation states that it is not possible with CPU or memory triggers.
Conclusion
KEDA ties the pod count to the events that matter, provided you monitor its scalers like any production component. Sources: kedacore/keda repository and keda.sh documentation.
span.observer is an independent community blog, not affiliated with Dynatrace LLC or the projects mentioned. Brands belong to their owners. Tools change quickly: check commands and options in their official documentation.