Datadog Flex Logs is a log storage tier that separates storage from compute: you keep large volumes for a long time and pay for query capacity separately. According to the Datadog documentation, it aims at cost-effective live querying over long retention. For an SRE team, the real question is not “should we enable it?” but “which logs leave standard indexing, and which must stay?”.
This article offers a decision grid based only on the official documentation, read on 30 October 2026. It quotes no prices: they change, so read them on Datadog’s official pricing page. The content applies to Datadog; the Dynatrace comparison covers concepts, not feature equivalence.
In short
- Datadog describes three options: standard indexing, Flex Logs and archiving.
- Flex Logs supports neither monitors nor Watchdog; dashboards are supported.
- Compute is the query capacity, sized by the number of stored events.
- Logs that feed alerts should stay in standard indexing.
Datadog Flex Logs: the three options in the documentation
The documentation separates three uses. Standard indexing suits logs queried often and kept briefly, such as application logs. Flex Logs suits logs kept long term that sometimes need urgent querying: security, transaction and network logs. Archiving suits logs rarely queried and stored long term, such as audit and configuration logs.
The options combine. The documentation says you can retain logs in standard indexing first, then extend them with Flex Logs. Index filters also apply to the Flex tier of that index.
Archiving is a separate mechanism. According to the Log Archives page, it forwards every ingested log, indexed or not, to a bucket you own (AWS S3, Azure Storage or Google Cloud Storage). You then reach it through rehydration or archive search.
What Flex Logs does not do: monitors and Watchdog
This limit decides everything. The documentation is explicit: monitors are not supported, and neither is Watchdog. Dashboards work, but their queries count toward compute sizing.
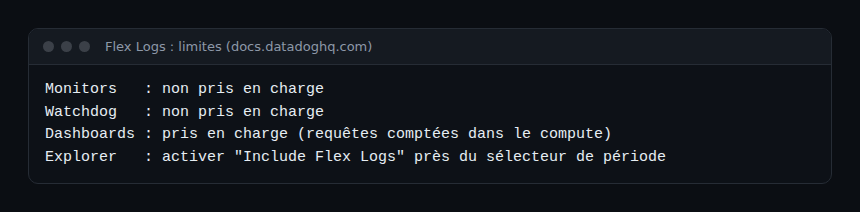
For an SRE, a log that feeds an SLO alert cannot live in Flex alone. An audit or network flow log you only read after an incident can. The test is simple: does this log trigger something, or does it mainly support investigation? For the difference between alerting and exploring, see our article on observability versus monitoring.
Understanding compute and retention
Compute sizes
Compute is the querying capacity for Flex Logs. According to the documentation, it is not used for ingestion or for searching only standard-indexed logs. The sizes are Starter, XS, XS+, S, M and L; each offers roughly twice the performance and capacity of the previous one. Capacity is limited by concurrent queries and by the maximum number of logs scanned per query.
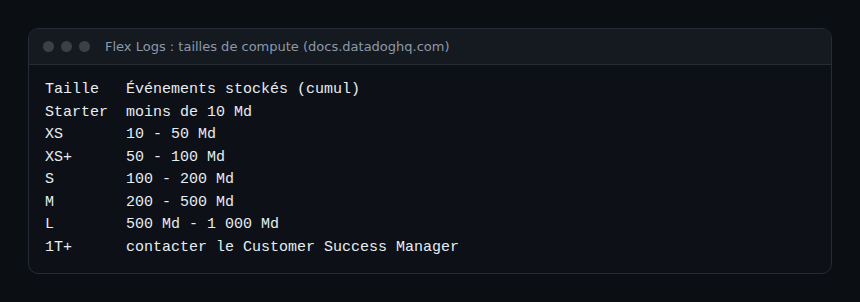
These thresholds are the documentation’s recommendations. Per Datadog, Starter is billed at a bundled storage-plus-compute rate and the XS to L sizes at a flat rate. When capacity is reached, queries slow down and retry; those that retry repeatedly may fail, with the message “Flex Logs compute capacity is constrained”.
Retention
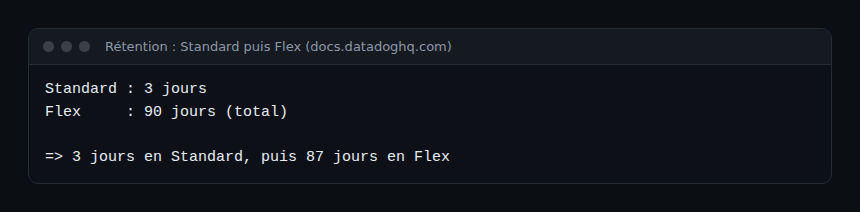
According to the documentation, Starter retention is 3, 6, 12 or 15 months; scalable sizes range from 30 to 450 days. If an index combines both tiers, logs stay in standard until the standard retention ends, then move to Flex for the remainder.
Decision grid: which logs to move off standard indexing
The documentation lists sources that are candidates for direct-to-Flex: audit logs (CloudTrail, Kubernetes audit), CDN, CI/CD, DNS, identity, load balancers, network appliances and service meshes. The grid below is our own interpretation, not a vendor recommendation.
| Question | If yes | If no |
|---|---|---|
| Does a monitor or Watchdog rely on this log? | Keep in standard | Flex candidate |
| Must it be kept longer than standard retention? | Extend with Flex | Stay in standard |
| Is it almost never read but required for compliance? | Flex or archive | Standard |
| Must you search it live after an incident? | Flex rather than archive | Archive |
A useful tip: before moving a stream, list your existing log monitors. If one queries that stream, create a log-based metric or keep that subset in standard. Exclusion filters on indexes remove valueless logs from the index, while they stay available in Livetail, archives and log-based metrics.
Configure a Flex tier step by step
- Check that you hold the
flex_logs_config_writepermission: enabling happens at organisation level. - Open the Flex Logs Control page, choose the compute type and size, then click Enable Flex Logs. Starter is recommended below 10 billion stored logs.
- In Indexes Configuration, edit or create an index, select Flex Tier and set retention under Configure Storage Tier and Retention.
- In the Log Explorer, toggle “Include Flex Logs” next to the time picker to query that tier.
When you enable Flex on a standard-only index, the documentation says retention is extended for both existing and new logs. Compute upgrades can happen at any time; downgrades are allowed once every 15 days.
How to check that it works
- In the Log Explorer, enable “Include Flex Logs” and confirm that logs older than the standard retention appear.
- Run a query typical of a real investigation and watch its duration. The constrained-capacity message signals undersized compute.
- Check that no log monitor has gone quiet: a monitor on a stream moved to Flex alone will no longer see those logs. Test this yourself; the documentation only states that monitors are not supported.
Best practices
- Migrate one stream at a time, starting with audit or network logs that have no alert.
- Keep application error logs tied to your SLOs in standard indexing.
- Reassess the compute size when cumulative events move to the next band.
- Keep a list of streams and their tier: it removes avoidable toil for on-call.
What about OpenTelemetry and Dynatrace?
The tier choice happens after ingestion: an OpenTelemetry Collector sends the same logs whatever the destination, and the sorting happens in index configuration. That is a good reason to filter and enrich early, as in our article on the OpenTelemetry Collector on Kubernetes. For retention cost trade-offs, see also Datadog APM ingestion and span retention and our Dynatrace and Datadog comparison.
In Dynatrace, per the documentation, logs go into Grail buckets with retention from 10 days to 10 years (35 days for the default_logs bucket). An OpenPipeline processor assigns records to a bucket, which separates logs by retention. The model differs from Datadog’s: do not look for a term-for-term equivalent.
If you compare with Elastic, our article on the Elasticsearch frozen tier covers the same cost and latency trade-off.
Frequently asked questions
Does Flex Logs replace standard indexing?
No. The documentation presents complementary options: you can keep logs in standard, then extend with Flex. Monitors and Watchdog stay tied to standard indexing.
How is it different from archiving?
An archive is storage in your own bucket, reached through rehydration or archive search. Flex Logs stays queryable in the Log Explorer with dedicated compute capacity.
Where can I find prices?
Only on Datadog’s official pricing page, which is authoritative and may change. We quote no price from third-party sites.
Conclusion
Moving logs off standard indexing is a reliability decision as much as a cost one. Keep what alerts in standard, send to Flex what is read long after the fact, and archive the rest. Test first on a stream with no monitor.
span.observer is an independent blog, not affiliated with Dynatrace LLC or Datadog Inc. Product names belong to their owners; values come from the official documentation read on 30 October 2026 and may change.