Dynatrace Service backtrace answers an on-call question: who, upstream, triggers this database query that is running hot? Dynatrace SaaS version 1.347 (rollout started on 16 September 2026, page last updated on 6 October 2026) bundles three changes that shorten this kind of investigation: a side overlay to read a trace, a backtrace from the database queries in Services, and call chains from any Smartscape node.
This article is my own analysis of the “sprint 347” release notes and of the Distributed Tracing, Services and Smartscape documentation pages, read on 27 and 29 October 2026. I have not tried these screens in an environment: I only describe what the documentation describes, and I flag what it leaves out. Everything applies to Dynatrace SaaS; Dynatrace Managed has neither Grail nor these apps.
If traces are new to you, start with Distributed traces and PurePath. For the topology side, DQL Smartscape explains the traverse syntax.
What sprint 347 brings to investigations
- Distributed Tracing: the notes announce investigating a trace in a side overlay, without changing the current view.
- Services: a Service backtrace from a statement in the Database queries view, to walk back to the callers.
- Smartscape: multi-hop call chains, downstream and upstream, from any node, plus a problem view that labels a node as root cause, affected or related.
The same release has two breaking changes to read before updating dashboards: a new endpoint naming pattern (volatile path segments become {id} or {token} placeholders) and the move of billing usage events from entity IDs to Smartscape IDs, for example dt.entity.host to dt.smartscape.host. Custom DQL queries relying on those fields need a review.
Trace side overlay: read a trace without losing your list
According to the app page, selecting a trace opens the single trace perspective in a panel on the right of the screen. It holds a waterfall view of the spans, with one duration bar per span, one colour per service and an icon per span kind, then a details panel with the tabs Span details, Logs, Exceptions, Code stack trace and Linked traces.
The practical gain is that, according to the release notes, the underlying view stays visible and usable. You can compare several traces from one filtered list without rebuilding your filters each time. The documentation I read does not describe switching between the two modes, so I say no more.
Dynatrace Service backtrace from database queries
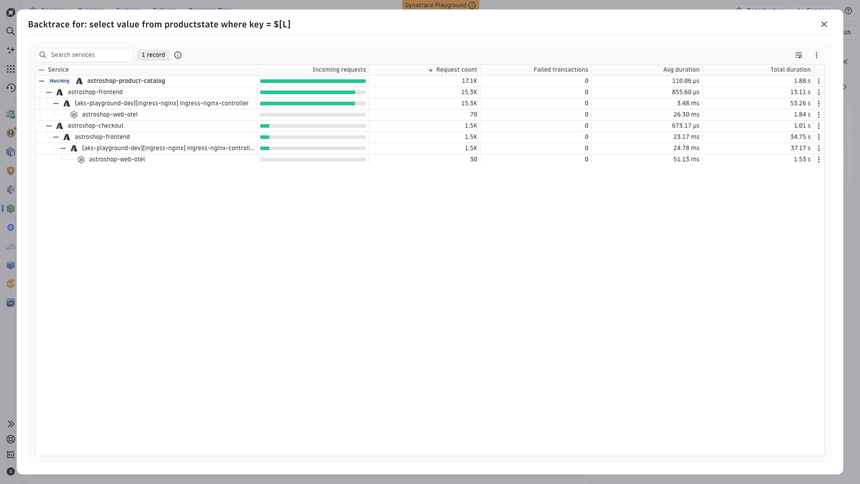
The “Backtrace” page, published on 23 September 2026, describes it like this: the computation starts from spans matching a filter (a query, a URL) and walks the trace data backwards to build a ranked tree of callers, up to the entry points. You see which services drive the load or the failures, and for what share of traffic.
Where to start it
The documentation names two places in Services: the Database queries tab (action menu on the query cell for an environment-wide view, or on the row for a view scoped to the current service) and the Outbound calls tab, through the Outgoing URL column. Opening it from Distributed Tracing is listed as coming soon.
What the tree shows
Matching services are the roots, tagged “Matching”; you expand their callers level by level. Each row gives the service name, the traffic share (green for successful requests, red for failures), an estimated request count adjusted for sampling, the number of failed spans, the average duration and the total duration. The row menu leads to View service, Analyze failures and Analyze response time.
Limits to know
- The analysis uses a representative sample of traces from the last 24 hours of the selected timeframe; an info chip shows the sampling ratio.
- With no caller found, the documentation suggests widening the timeframe and reopening the view.
- By default, spans with an incomplete upstream chain (missing parent) are excluded, so a parent’s totals equal the sum of its children.
- Prerequisites: a backend instrumented with OneAgent or OpenTelemetry, and access to Services.
Call chains and linked problems in Smartscape
The notes announce multi-hop views, downstream and upstream, from any node, and a problem view that qualifies the node: root cause, affected or related. The Smartscape app page I read talks about a service dependency graph and a problems graph (anomalies mapped to impacted entities), without using the words “call chain” or detailing the screens. For this feature I therefore rely on the release notes only.
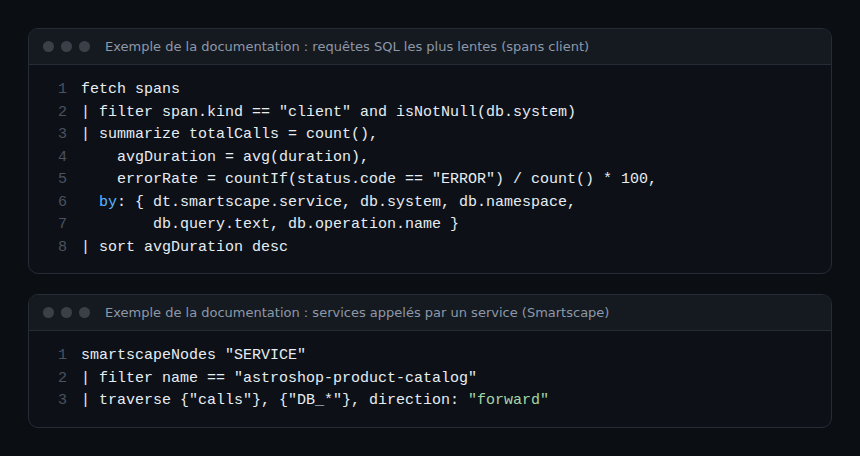
In DQL, the Smartscape service documentation expresses the same logic as queries. Official example: the services a service calls, with traverse forward.
smartscapeNodes "SERVICE"
| filter name == "frontend-web"
| traverse {"calls"}, {"SERVICE"}, direction:"forward"
The reverse exists: direction accepts forward or backward (see the DQL Smartscape guide). I did not run an upstream variant; check it in a notebook before putting it in a runbook.
An investigation scenario, step by step
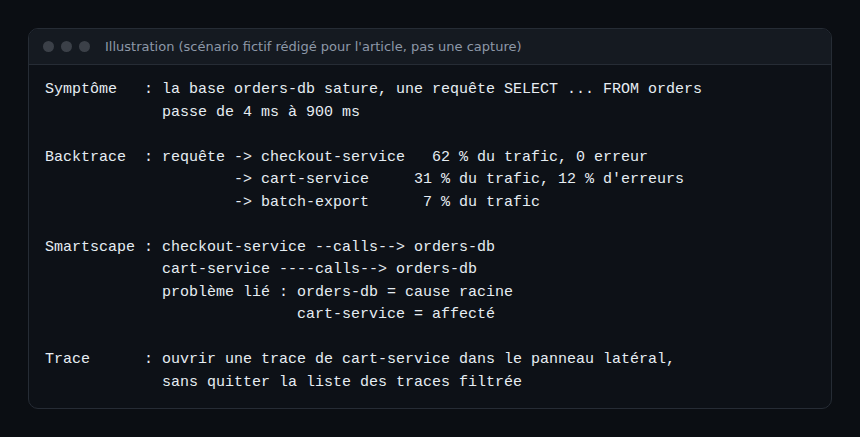
The scenario below is fictional, written to show how the three tools chain together; it is not a screenshot.
Step 1: isolate the guilty query
In the Database queries view, spot the query whose duration drifts. The documentation offers a DQL ranking by average duration and error rate, based on client spans carrying db.system.
Step 2: open the backtrace of that query
From the query’s action menu, start the backtrace. Read the tree top-down: which caller carries the biggest share of traffic, which one concentrates the failures? A single upstream request can trigger several database executions (fan-out), which the per-caller distribution makes visible.
Step 3: place the node in Smartscape
From the database or suspect service node, browse the call chains and the problem view to learn whether the node is the root cause or an affected node. That keeps you from treating a symptom.
Step 4: confirm on a trace
Open a trace from a failing caller in the side overlay and check the slow spans, logs and exceptions without leaving your list.
Best practices
- Instrument OneAgent or OpenTelemetry on every hop: an incomplete upstream chain skews the tree.
- Widen the timeframe if the backtrace is empty, but remember the sample only covers 24 hours.
- Keep the link between the alert and the query: an SLO, an error budget and an MTTR read better with a named caller.
- Review queries that use
dt.entity.*before the move todt.smartscape.*. - Stay blameless: a backtrace shows flows, not team faults.
Frequently asked questions
Does Service backtrace replace trace analysis?
No. It aggregates callers from a sample of traces; the individual trace then helps you understand one specific case.
Do I need to enable anything for Service backtrace?
According to the documentation, no specific configuration: the backend must be instrumented with OneAgent or OpenTelemetry and you need access to Services.
Do these features exist in Dynatrace Managed?
They are described for Dynatrace SaaS (Grail, Smartscape on Grail). For Managed, read the Managed documentation and the SaaS learning path to compare.
Conclusion
Sprint 347 links three gestures: reading a trace without losing your view, going from a query to its callers, placing a node in the topology. Read the sprint 347 notes and the Backtrace page, then validate in your own environment.
span.observer is an independent community blog, not affiliated with Dynatrace LLC. Dynatrace is a trademark of Dynatrace LLC. SaaS features change quickly: check their availability in your environment and in the official documentation. Screenshots come from the official documentation (source cited); the scenario is an illustration.