Elasticsearch shard size decides how fast your searches run, how much memory the cluster uses and how easy it is to operate. Too small, and shards pile up and overload the master node. Too large, and they slow recovery after an incident. This article gathers the official guidance and shows how to apply it with ILM rollover.
The goal: set a target size, automate it in an ILM policy, then check the result. The figures below come from the Size your Elasticsearch shards page (read on 30 October 2026; no version number is shown). They are Elastic’s guidelines, not span.observer measurements: test them against your own data.
In brief
- According to Elastic, aim for shards of 10 GB to 50 GB and fewer than 200 million documents per shard.
- The classic trap is oversharding: many small shards cost more than one large one.
- Size-based rollover (
max_primary_shard_size) avoids tiny indices created on a fixed schedule. - Shards are immutable: fixing a wrong size means copying the index (Split or Reindex).
Elasticsearch shard size: the official guidelines
The documentation gives three reference points. First, size: “aim for shard sizes between 10GB and 50GB”. Second, document count: keep it below 200 million per shard. Third, the hard Lucene limit of 2,147,483,519 documents per shard (deleted documents included), far above the recommendation.
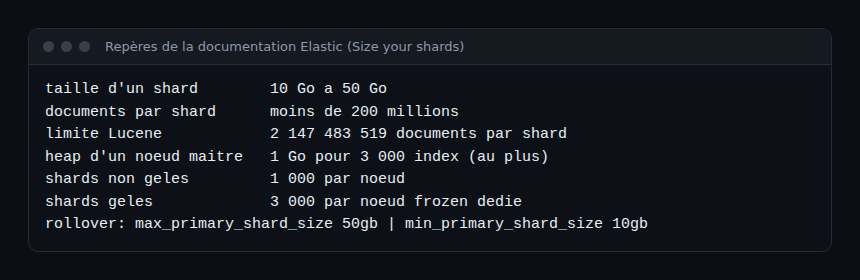
The same page sets cluster limits: 1,000 non-frozen shards per node, and 3,000 frozen shards per dedicated frozen node. For master nodes, it gives at most 3,000 indices per GB of heap. A master with 4 GB of heap therefore supports fewer than 12,000 indices, before counting baseline memory.
For an SRE, the link to reliability is direct. A cluster beyond these limits slows down at every state change, and that slowdown erodes your search SLOs before any alert fires. See also our guide to monitoring Elasticsearch with Dynatrace.
Why too many small shards are expensive
Every shard carries a fixed cost in memory and search work. Elastic’s own example is telling: searching a thousand 50 MB shards is “substantially” more expensive than searching one 50 GB shard holding the same data.
The page lists several remedies: reduce the shard count with Shrink, reindex short-period indices into longer-period ones, and delete empty indices. Force merge also reduces the segment count, but it is resource-intensive. Run it off-peak, on indices you no longer write to.
Conversely, oversized shards are not quantified on that page, and it gives no figure for their effect on recovery. We therefore do not claim one here; measure relocation time on your own cluster.
Drive shard size with ILM rollover
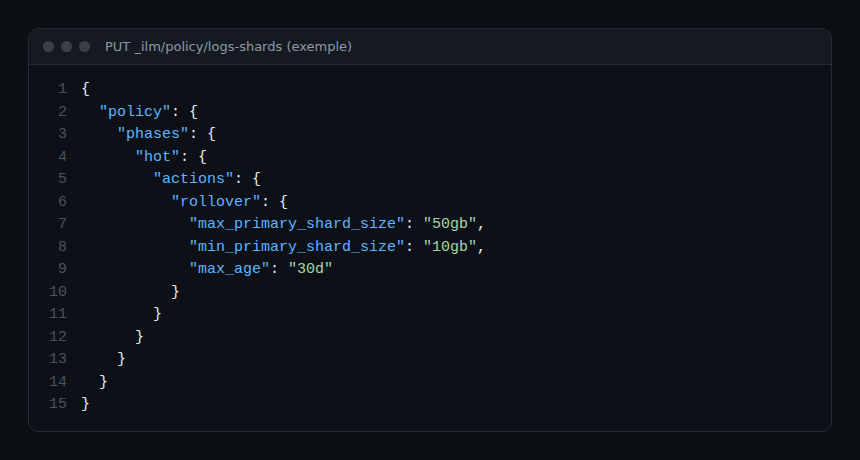
The simplest way to hold the target is rollover in the hot phase of an ILM policy. According to the rollover action reference, the action needs at least one max_* condition, and rollover happens when a max_* condition is met and all min_* conditions are met too.
PUT _ilm/policy/logs-shards
{
  "policy": {
    "phases": {
      "hot": {
        "actions": {
          "rollover": {
            "max_primary_shard_size": "50gb",
            "min_primary_shard_size": "10gb",
            "max_age": "30d"
          }
        }
      }
    }
  }
}
This policy is an example built from the documented options; the 30-day value is the author’s choice, not an Elastic recommendation. The two size thresholds reuse those of the “Size your shards” page: 50 GB at most, 10 GB at least to avoid undersized shards.
Points to watch in the options
max_primary_shard_sizetargets the largest primary shard, replicas ignored.max_sizeis marked deprecated since version 9.3, withmax_primary_shard_sizeas its replacement.- A shard reaching 200,000,000 documents triggers an implicit rollover. A higher
max_primary_shard_docshas no effect. - An empty index is not rolled over by default, even if
max_ageis met. Add"min_docs": 0to allow it. - Elastic advises against rolling over on time alone: it often produces many small indices.
Steps: audit your shards, then fix them
- List the shards, largest to smallest, with the cat shards API.
- Spot indices below 10 GB and those above 50 GB.
- Apply a size-based ILM rollover policy to new indices.
- Fix existing ones with Shrink, Reindex or Split as appropriate.
- Watch the shard count per node over time.

GET _cat/shards?h=index,shard,prirep,docs,store&s=store:descThe columns index, shard, prirep (primary or replica), docs and store appear in the API reference. The s parameter sorts the output. Look for rows with a very small store, a sign of oversharding.
If the cluster hits the per-node limit, Elastic gives the example of raising cluster.max_shards_per_node to 1200, but states that this setting should stay temporary. It hides the problem without solving it.
Fixing shards that are already mis-sized
Shards are immutable. To change their number or size, you must copy the index: Split to add primary shards, Reindex into a well-configured index to consolidate. According to the page, Restore Snapshot and Clone Index are not enough for this purpose.
How to check that it works
After a few rollover cycles, run the _cat/shards request again. New indices should sit between 10 GB and 50 GB per primary shard. If many indices stay tiny, check the max_age condition and add a min_primary_shard_size threshold. In Dynatrace, you can track shard counts and search latency through the extension described in the article above (SaaS or Managed, depending on the extension deployed).
Link with OpenTelemetry and your observability data
OpenTelemetry traces, metrics and logs arrive at a variable rate: a traffic spike causes an indexing spike. Size-based rollover adapts to that rhythm, whereas a daily index does not. To cut volume before indexing, see OpenTelemetry tail sampling, and for the difference between signals, observability versus monitoring. To compare platforms, our Dynatrace and Datadog comparison sets out operational criteria.
Best practices
- Start from a 10 to 50 GB target and adjust with your own load tests.
- Prefer rollover by size or document count over purely time-based rollover.
- Raise
max_shards_per_nodeonly as a temporary measure. - Schedule force merge off-peak, on read-only indices.
- Write the target size into your runbook, without blaming the team that created the existing indices.
Frequently asked questions
What is the ideal Elasticsearch shard size?
Elastic recommends 10 GB to 50 GB, with fewer than 200 million documents per shard. It is a guideline: the right figure depends on your queries and hardware.
What happens if my shards are too small?
The cluster carries a fixed cost per shard, and searches touch more shards. Consolidate them with Shrink or Reindex, and avoid purely time-based rollover.
Can I change the size of an existing shard?
No, a shard is immutable. You must copy the index with Split or Reindex into a correctly configured index.
Conclusion
Keep one rule: 10 to 50 GB per shard, size-based rollover, a regular audit with _cat/shards. The exact values remain yours to validate on your data. The limits and options cited come from the official Elastic pages read on 30 October 2026.
This article comes from an independent blog, not affiliated with Dynatrace LLC or Elastic N.V. Elasticsearch is a trademark of Elastic N.V. Figures cited are from the official documentation, not span.observer measurements.