The ES|QL metrics TS command is a dedicated entry point for metrics in Elasticsearch. It reads time series indices and lets you compute rates and averages without writing Query DSL aggregations. Elastic introduced it in October 2025 in an Observability Labs post (Elastic Observability 9.2, “tech preview”), together with a metrics explorer in Discover.
This article is for SRE and platform teams: what TS does, where its status stands today, how to write a first query, and what the ES|QL PROMQL command changes for people coming from Prometheus. The facts come from Elastic’s official pages, read on 30 October 2026. They concern Elasticsearch, not Dynatrace; the Dynatrace angle comes further down.
In brief
TSis a source command, close toFROM, that only reads indices intime_seriesmode.- According to the documentation, it is generally available on Elastic Cloud Serverless and, for the Elastic Stack, generally available since 9.4 (preview from 9.2 to 9.3). The October 2025 post therefore lags behind the current status.
- A query has two levels: an inner function per series (
RATE,AVG_OVER_TIME), then an outer function (SUM,AVG) that groups the results. - For counters, the docs recommend
TSoverFROM | STATS.
ES|QL metrics TS command: what it does
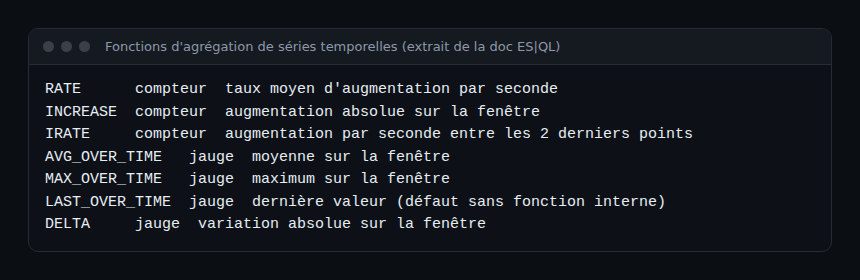
A metric is a series of timestamped points. An HTTP request counter only grows, apart from resets when a process restarts. Adding up its raw values therefore means little. The command’s reference page explains that RATE() or INCREASE() first compute per-series changes, handling resets, before any aggregation.
The principle is the two levels. The inner function runs for each time series, often per time bucket. The outer function then combines the results by group. If you omit the inner function, LAST_OVER_TIME() is applied implicitly to numeric fields. Elastic’s post gives this equivalence.
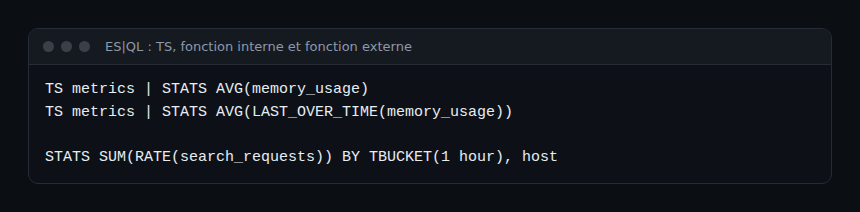
The second benefit concerns metrics published at uneven intervals. By first reducing each series to one value per bucket, a chatty host no longer dominates the average, according to Elastic’s documentation.
Status and version: where the feature stands
The post’s title speaks of a “tech preview”. It dates from October 2025 and targeted 9.2. The current reference page says otherwise: generally available since 9.4 for the Elastic Stack, preview from 9.2 to 9.3, and generally available on Serverless. Check your version before building a runbook on this command.
Details vary by function. According to the page on time series aggregation functions, RATE, INCREASE, AVG_OVER_TIME and LAST_OVER_TIME are generally available since 9.4. PERCENTILE_OVER_TIME, STDDEV_OVER_TIME and DERIV appear as preview in 9.3, and CHANGES is listed as planned. Re-read that table at each upgrade.
Writing a first query with TS
Prerequisites: an index or data stream in time_series mode (TSDS), on an Elasticsearch version that offers TS. The field names below are examples; replace them with your own.
- Target the metrics indices. Per the docs, wildcards only match time series indices and silently skip the others.
- Bound the time range. The documentation advises a filter on
@timestamp. - Pick the inner function by metric type:
RATEfor a counter,AVG_OVER_TIMEfor a gauge. - Pick the outer function and the grouping, for example by time bucket with
TBUCKETand by service.
TS metrics-*
| WHERE @timestamp >= NOW() - 1 hour
| STATS requests_per_second = SUM(RATE(http_requests_total))
        BY TBUCKET(5 minutes), service.name
| SORT requests_per_second DESC
This query is an example written from the documentation’s syntax, not a production capture. One caution: the docs state that SORT and FORK cannot sit between TS and the first STATS. Here SORT comes after, which is allowed.
Documented pitfalls
- Nesting one time series function inside another raises an error.
- Functions enforce the field’s
metric_type:RATErequires a counter. - After the first
STATS,COUNT(*)counts per-series rows, not documents. UseCOUNT(field)orCOUNT_OVER_TIME. - Results are truncated to 10,000 rows by default.
- Mixing metrics with different dimension cardinalities in one expression propagates nulls.
Discover and the metrics explorer
The post also describes a grid view in Discover. It starts from TS metrics-*, picks an aggregation by type (rate for counters, avg for gauges), lets you search a metric by name and group by dimension. Each metric shows its ES|QL query, generated automatically and addable to a dashboard. For an SRE the value is practical: start from the query the interface produces and refine it by hand.
The same post mentions a native OTLP endpoint for metrics, aimed mainly at self-managed deployments, with throughput gains claimed by Elastic (up to 60% through _otlp, 25% through _bulk). These are vendor figures, not verified by span.observer.
ES|QL or PromQL: the PROMQL command
If your team comes from Prometheus, ES|QL offers a second route. According to the command’s page, PROMQL works like TS but accepts a PromQL expression. It is generally available since 9.5 and in preview in 9.4.
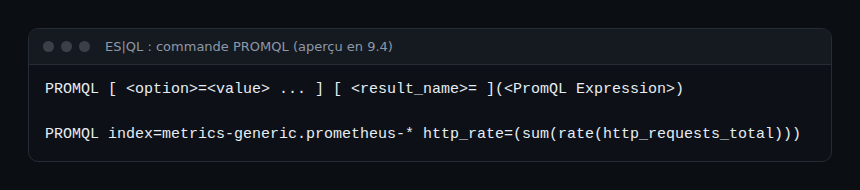
The page says PROMQL “supports most, but not all” of PromQL. The and and unless operators, group modifiers (on, ignoring, group_left), the @ modifier and subqueries return a client error. Test your existing rules one by one rather than assuming full compatibility. To place PromQL next to OpenTelemetry, see OpenTelemetry and Prometheus: complementary.
What this changes for an SRE team, with OpenTelemetry and Dynatrace
For metrics stored in Elasticsearch, TS brings rate calculation closer to what metrics-oriented tools do. Counter-based SLIs (error rate, requests per second) become readable queries, with a computable error budget. The cost still needs measuring: size your time series indices and shards with your own tests.
On the OpenTelemetry side, the post cites OTLP metric ingestion; remember that traces, metrics and logs are distinct signals, and TS only handles metrics. For OpenTelemetry metrics in Dynatrace, the conceptual equivalent is DQL’s timeseries command, covered in our guide to DQL commands. This is an analogy, not a documented integration. Dynatrace SaaS runs DQL on Grail; for Managed, check which functions are available. For a wider platform comparison, read our Dynatrace and Datadog comparison.
How to check that it works
- Run
TS metrics-* | LIMIT 5in Discover’s ES|QL mode: you should see rows sorted by descending@timestamp. No rows often means the indices are not intime_seriesmode. - Run the query with
RATEon a counter. An error aboutmetric_typemeans the field is not declared as a counter in the mapping. - Compare the result with an existing chart over the same period before migrating a dashboard.
Best practices
- Record the Elastic version in the runbook: function status differs between 9.2, 9.3, 9.4 and 9.5.
- Use
RATEorINCREASEfor counters, never a raw sum. - Always filter
@timestampbefore aggregating. - Keep queries generated by Discover under version control if they feed alerts.
- Do not hunt for a culprit: a surprising result usually comes from the mapping, not from a team.
Frequently asked questions
Is the TS command still a tech preview?
The October 2025 post presented it that way. The reference page read on 30 October 2026 states general availability since 9.4 for the Elastic Stack and on Serverless.
What is the difference between TS and FROM for metrics?
TS only reads time series indices and enables functions such as RATE or AVG_OVER_TIME inside STATS. For counters, Elastic recommends it over FROM | STATS.
Can I reuse my PromQL queries?
Partly: the PROMQL command accepts PromQL, but not every operator. Test each rule before migrating.
Conclusion
The TS command gives ES|QL a metrics vocabulary: rates, deltas, two aggregation levels. Check your version, start from a simple query and validate against a chart you know. To go further on the Prometheus side, see Prometheus and Dynatrace on Kubernetes.
This article comes from an independent blog, not affiliated with Dynatrace LLC or Elastic N.V. Elasticsearch and Elastic are trademarks of Elastic N.V. Figures and statuses cited come from Elastic’s documentation and blog, not from span.observer measurements.