agent-sandbox Kubernetes: the kubernetes-sigs/agent-sandbox repository provides a Sandbox custom resource and its controller for running isolated, stateful, single-instance workloads, such as the runtime of an AI agent executing model-generated code. The project lives under the Kubernetes SIGs organisation, under the umbrella of SIG Apps. The repository page showed about 4,400 stars and about 590 forks on 29 October 2026, under the Apache 2.0 licence.
For an SRE or a platform team, the question is twofold. First, what does this controller actually do, and what does it not do? Second, once dozens or hundreds of sandboxes are created and destroyed every minute, how do you know they start quickly, expire as planned, and that the controller copes with the load? This article follows the README, the repository documentation and the agent-sandbox.sigs.k8s.io site.
A note on honesty: span.observer has not installed agent-sandbox. The commands come from the README and the project documentation; the screenshots reproduce excerpts from the repository or are taken from it directly.
agent-sandbox Kubernetes: what the repository says
- Project: the README presents agent-sandbox as a
SandboxCRD and Kubernetes controller developed under SIG Apps. The served API isagents.x-k8s.io/v1beta1; the roadmap states thatv1beta1is now the only served version and thatv1alpha1has been removed. - Licence and language: Apache 2.0, checked in the repository’s LICENSE file on 29 October 2026. The controller is written in Go; Go and Python SDKs are provided.
- Version: the releases page lists v1.0.8 as the latest release, published on 22 October 2026, with weekly releases since late September. The Helm chart in the repository is at version 0.1.4.
- Scope: the README is explicit, agent-sandbox is a sandbox orchestrator. Isolation is delegated to a secure runtime such as gVisor or Kata Containers, selected through
RuntimeClassin the pod template. Without that runtime, a Sandbox is an ordinary pod. - Use cases listed: AI agent runtimes executing untrusted code, reinforcement learning loops, development environments, notebooks, single-instance services.
A tour of the manifests
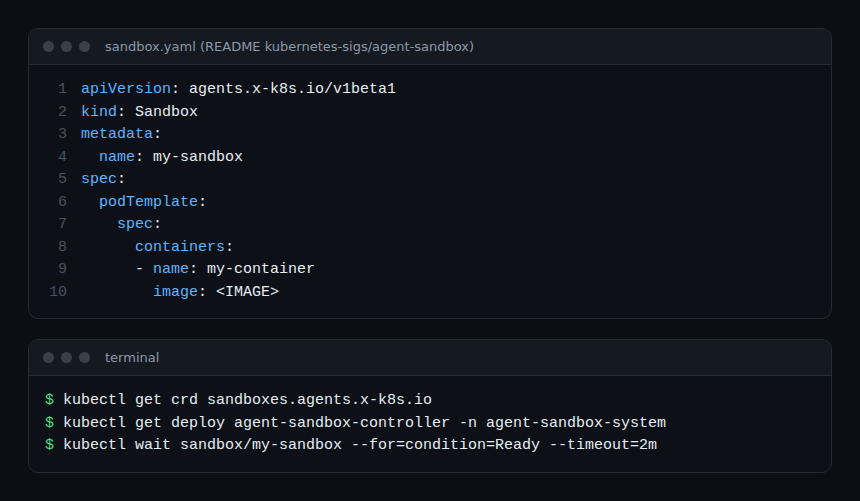
A Sandbox looks like a StatefulSet of size 1 with a dedicated lifecycle. According to the README, each Sandbox gets a stable hostname, can be given persistent storage, and can be paused and resumed. The getting-started example in the README fits in ten lines.
The extensions module adds three resources in the extensions.agents.x-k8s.io/v1beta1 group:
SandboxTemplate: a reusable blueprint for creating similar Sandboxes;SandboxWarmPool: a pool of pre-warmed Sandboxes ready to be allocated;SandboxClaim: the request for a Sandbox, served from a pool when possible.
The repository quickstart explains the mechanism: the pool creates Sandboxes labelled agents.x-k8s.io/warm-pool-sandbox, a SandboxClaim adopts one of them, and the pool creates a replacement to keep its replica count. The same document claims sub-2-second allocation with a pool, against 10 to 30 seconds without one (image pull and container or VM start-up). These are the project’s figures, not a measurement by span.observer.
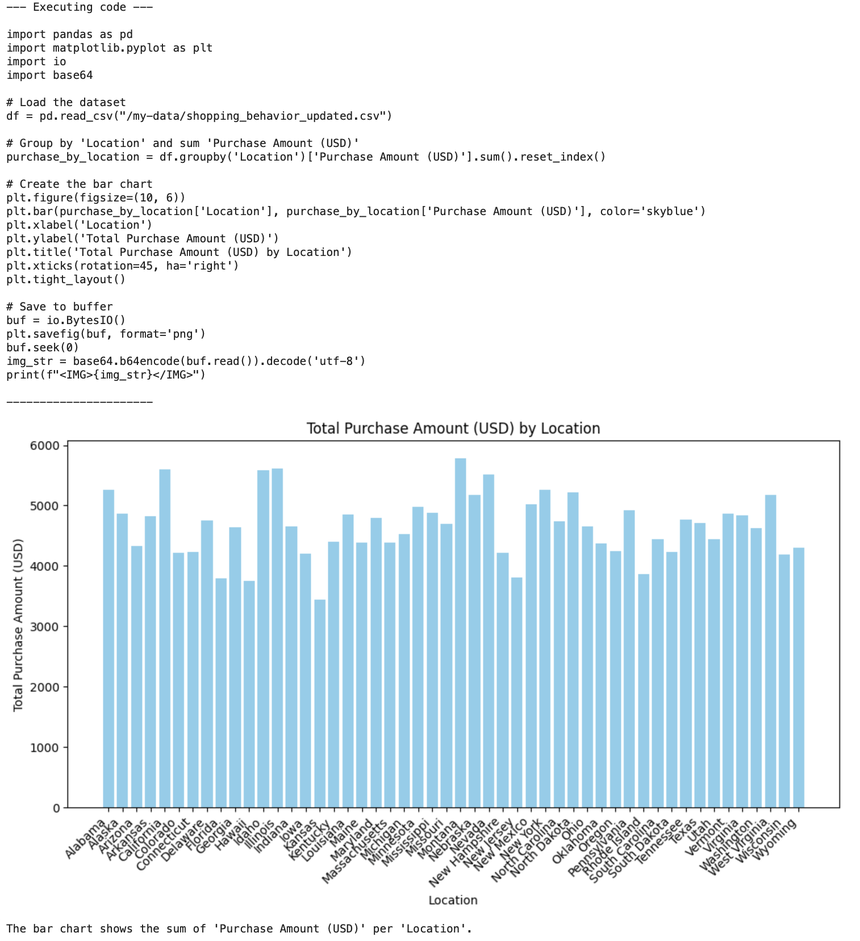
What an agent then does inside the sandbox depends on the image. The repository’s analytics-tool example shows an agent generating pandas and matplotlib code, running it in the Sandbox pod and returning a base64-encoded chart.
Step-by-step installation
Step 1 — Prerequisites
A Kubernetes cluster and kubectl. The site’s installation guide suggests a KinD or GKE cluster; the quickstart asks for kubectl 1.28 or later and, for real isolation, a cluster with gVisor or Kata Containers configured.
Step 2 — Install the controller and extensions
The README recommends pinning a version for production and GitOps:
export VERSION="v1.0.8"
kubectl apply -f https://github.com/kubernetes-sigs/agent-sandbox/releases/download/${VERSION}/sandbox-with-extensions.yaml
The sandbox.yaml (core only) and extensions.yaml manifests also exist separately. A Helm chart ships in the repository’s helm/ directory; its README states that image.tag is required and that Helm does not update the CRDs in crds/ during helm upgrade.
Step 3 — Verify
kubectl get crd sandboxes.agents.x-k8s.io
kubectl get deploy agent-sandbox-controller -n agent-sandbox-system
Step 4 — Create a Sandbox and wait for Ready
Apply the manifest from the screenshot with an image of your choice, then wait for the Ready condition. The “Status Conditions” page of the documentation states that Ready is the authoritative signal: there is deliberately no Running condition.
kubectl wait sandbox/my-sandbox --for=condition=Ready --timeout=2m
kubectl get sandbox my-sandbox -o jsonpath='{.status.conditions[?(@.type=="Ready")].reason}'
The SDKs follow the same logic: pip install k8s-agent-sandbox for Python, go get sigs.k8s.io/agent-sandbox/clients/go/sandbox@latest for Go. They go through the Sandbox Router, an optional HTTP reverse proxy that routes requests to the pod, useful when direct port-forwarding is unavailable with Kata or gVisor.
Observing the sandboxes: metrics, conditions, traces
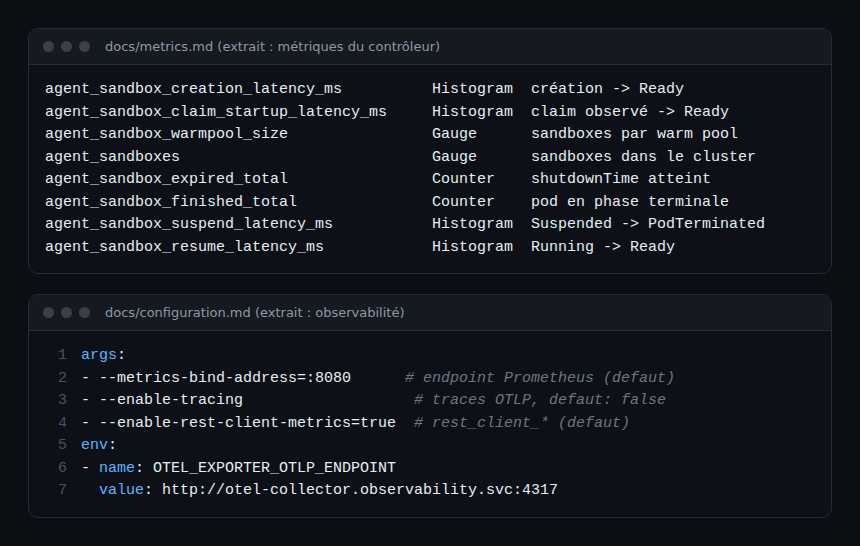
This is where the project stands out from many trending repositories: observability is documented. The docs/metrics.md file, generated from the code, lists the Prometheus metric families exposed by agent-sandbox-controller on --metrics-bind-address (default :8080).
Useful readings for an SLO:
agent_sandbox_creation_latency_ms: histogram of the time from Sandbox creation to its first transition to Ready, bynamespace,launch_typeandsandbox_template. The documentation warns that source timestamps have second-level precision.agent_sandbox_claim_startup_latency_msandagent_sandbox_client_claim_startup_latency_ms: end-to-end latency of a SandboxClaim, from the webhook observation or from the client timestamp to Ready. They are only recorded when the claim carries the matching annotation.agent_sandbox_warmpool_size: size of each pool, labelled bysandbox_status; a pool draining during a burst of claims shows up here.agent_sandboxes: number of Sandboxes in the cluster, withready_conditionandexpired.agent_sandbox_expired_totalandagent_sandbox_finished_total: expiries onshutdownTimeand pods that reached a terminal phase, with the reason.agent_sandbox_suspend_latency_msandagent_sandbox_resume_latency_ms: the cost of a suspend and a resume.
On top of these families come the standard controller-runtime metrics and, if --enable-rest-client-metrics stays at true, the client-go rest_client_* families (request latency, retries). An OpenTelemetry Collector with a Prometheus receiver is enough to collect all of this; see the OpenTelemetry Collector on Kubernetes and Prometheus and Dynatrace on Kubernetes.
For traces, the --enable-tracing flag (default false) enables OTLP export from the controller. There is no flag for the Collector address: the exporter reads the standard OTEL_EXPORTER_OTLP_ENDPOINT and OTEL_EXPORTER_OTLP_INSECURE variables. An operational point to remember: if the exporter cannot be initialised, the controller logs the error and exits at start-up. The Go and Python SDKs set the opentelemetry.io/trace-context annotation on the SandboxClaim, which links the client trace to the controller trace. The Python SDK documentation also shows local instrumentation with pip install "k8s-agent-sandbox[tracing]" opentelemetry-distro then opentelemetry-instrument python main.py.
With Dynatrace, these Prometheus metrics and OTLP traces are ingested the same way as for any Kubernetes component, on SaaS (Grail, DQL) as on Managed (without DQL). The controller and the router are services to observe like any other; what happens inside the sandbox is the agent’s own business, see guardrails for AI agents in production.
Limits and open points
- The project provides no isolation by itself: without a gVisor or Kata
runtimeClassName, model-generated code runs in a standard container. The repository’s threat model says so clearly and recommends enforcing the runtime through aSandboxTemplate. - According to the threat model, the “Managed NetworkPolicy” mode (ingress restricted to the router, egress without RFC 1918 networks or cloud metadata) applies when going through a SandboxTemplate; likewise,
automountServiceAccountTokenis only forced tofalsefor Sandboxes created from a template. A bareSandboxmust be fenced by an admission policy. - The site’s installation guide deploys the router with authentication disabled and a staging image, “for local testing only” according to the project’s warning.
- Deleting the CRDs cascade-deletes every Sandbox in the cluster, the README warns.
- Still “planned” on the roadmap: automatic suspend and scale to zero, a native MCP server, additional Prometheus telemetry, a web UI. Weekly releases show a young, active project: read the release notes before every update.
Good practices
- Alert on
agent_sandbox_warmpool_sizeand on the 95th percentile ofagent_sandbox_creation_latency_ms: these are your start-up SLIs. - Keep
--enable-pprof-debugdisabled in production; the documentation notes that these endpoints expose heap contents and goroutines. - Set
shutdownTimeandresources.limitsin every template: a sandbox with no end and no limit is a cost and a risk. - Connect the controller’s Kubernetes events to your alerts on nodes, pods and quotas, bearing in mind that
--disable-sandbox-eventsswitches them off under heavy load. - For scaling pools, the repository contains a
keda-scale-to-zeroexample; see KEDA Kubernetes autoscaling. For another approach to agent runtimes, see NVIDIA OpenShell.
Frequently asked questions
Does agent-sandbox isolate the code the agent runs?
Not by itself. The README describes it as an orchestrator that delegates isolation to gVisor or Kata Containers through RuntimeClass. You have to configure that runtime in the pod template.
Which metrics does the controller expose?
Prometheus metrics on :8080 by default, listed in docs/metrics.md: creation, claim, suspend and resume latencies, warm pool sizes, number of Sandboxes, expiries and pod terminations.
Can operations be traced with OpenTelemetry?
Yes. --enable-tracing enables the controller’s OTLP export, configured with OTEL_EXPORTER_OTLP_ENDPOINT. The SDKs propagate the trace context through the opentelemetry.io/trace-context annotation.
Conclusion
agent-sandbox brings Kubernetes a primitive that teams running AI agents were missing: an isolated, named, suspendable pod served from a warm pool. Its controller publishes what you need to monitor it from day one, provided you treat it as a production component: isolated runtime enforced, metrics collected, tracing enabled with care. Sources: kubernetes-sigs/agent-sandbox repository and agent-sandbox.sigs.k8s.io documentation.
span.observer is an independent community blog, not affiliated with Dynatrace LLC or the projects mentioned. Trademarks belong to their owners. Tools change quickly: check commands and options in their official documentation.